

Question: VaR= value at risk Example 1: You are recommending a change to an existing $500 million portfolio which has a Va of $50 million using
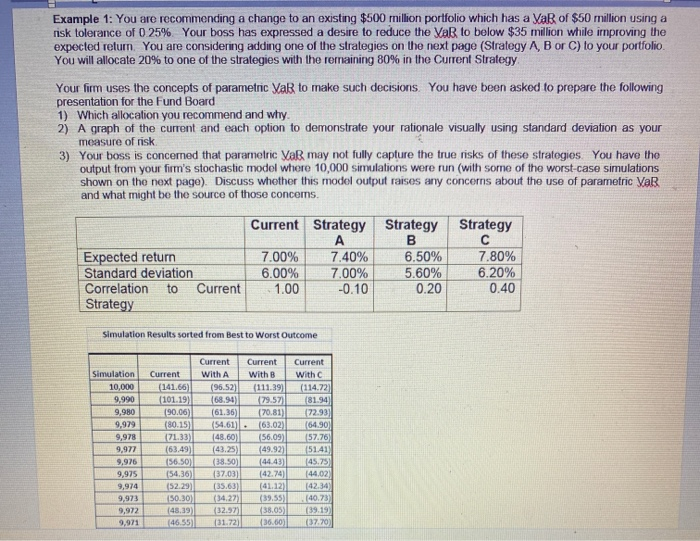
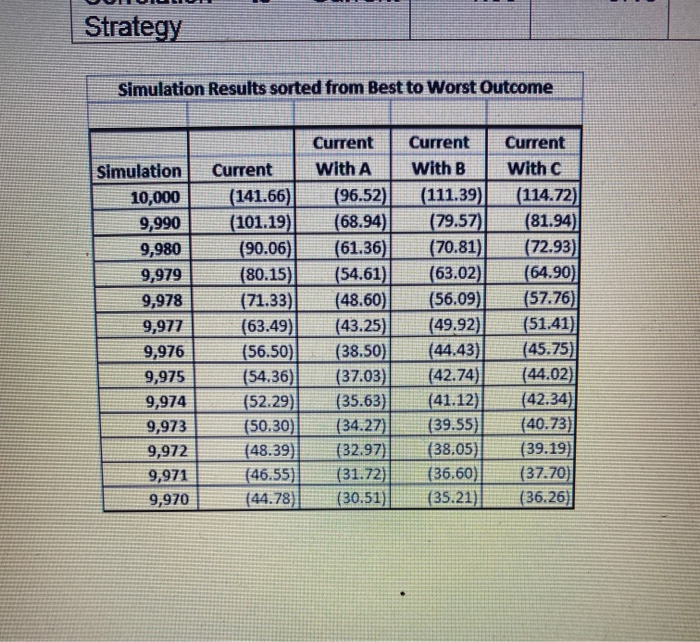
Example 1: You are recommending a change to an existing $500 million portfolio which has a Va of $50 million using a risk tolerance of 0.25% Your boss has expressed a desire to reduce the VaR to below $35 million while improving the expected retum. You are considering adding one of the strategies on the next page (Strategy A, B or C) to your portfolio You will allocate 20% to one of the strategies with the remaining 80% in the Current Strategy Your firm uses the concepts of parametric Vas to make such decisions. You have been asked to prepare the following presentation for the Fund Board 1) Which allocation you recommend and why 2) A graph of the current and each option to demonstrate your rationale visually using standard deviation as your measure of risk 3) Your boss is concerned that parametric Va may not fully capture the true risks of these strategies. You have the output from your firm's stochastic model where 10,000 simulations were run (with some of the worst-case simulations shown on the next page). Discuss whether this model output raises any concerns about the use of parametric VaR and what might be the source of those concerns. Expected return Standard deviation Correlation to Current Strategy Current Strategy Strategy A B 7.00% 7.40% 6.50% 6.00% 7.00% 5.60% 1.00 -0.10 0.20 Strategy 7.80% 6.20% 0.40 Simulation Results sorted from Best to Worst Outcome Simulation 10,000 9.990 9,980 9.979 9,978 9,977 9,976 9,975 9,974 9,973 9,972 9.971 Current (141.66) (101.19) (90.06) (80.15) (71.33) 163.49 (56.50 (54.36) (52.29 (50.30) (48.39) 146.55) Current with A (96.52) (68.94) (61.36) (54.61) (48.60) 143.25) (38.50) (37.03) (35.63) (34.27) (32.97 (31.72) Current With B (111.39) 79.57 (70.81) 163.02) 56.09 (49.92 (44.43) (42.74 (41.12) (39.55 (38.05 (36.60) Current With (114.72 (81.94 72.93) (64.90 57.76 (5141 145.75 144.02) (42.34 (40.73 (39.19 (37.70) Strategy Simulation Results sorted from Best to Worst Outcome Simulation 10,000 9,990 9,980 9,979 9,978 9,977 9,976 9,975 9,974 9,973 9,972 9,971 9,970 Current (141.66) (101.19) (90.06) (80.15) (71.33) (63.49) (56.50) (54.36) (52.29) (50.30) (48.39) (46.55) (44.78) Current With A (96.52) (68.94) (61.36) (54.61) (48.60) (43.25) (38.50) (37.03) (35.63) (34.27) (32.97) (31.72) (30.51) Current With B (111.39) (79.57) (70.81) (63.02) (56.09) (49.92) (44.43) (42.74) (41.12) (39.55) (38.05) (36.60) (35.21) Current with C (114.72) (81.94) (72.93) (64.90) (57.76) (51.41) (45.75) (44.02) (42.34)| (40.73) (39.19) (37.70) (36.26) Example 1: You are recommending a change to an existing $500 million portfolio which has a Va of $50 million using a risk tolerance of 0.25% Your boss has expressed a desire to reduce the VaR to below $35 million while improving the expected retum. You are considering adding one of the strategies on the next page (Strategy A, B or C) to your portfolio You will allocate 20% to one of the strategies with the remaining 80% in the Current Strategy Your firm uses the concepts of parametric Vas to make such decisions. You have been asked to prepare the following presentation for the Fund Board 1) Which allocation you recommend and why 2) A graph of the current and each option to demonstrate your rationale visually using standard deviation as your measure of risk 3) Your boss is concerned that parametric Va may not fully capture the true risks of these strategies. You have the output from your firm's stochastic model where 10,000 simulations were run (with some of the worst-case simulations shown on the next page). Discuss whether this model output raises any concerns about the use of parametric VaR and what might be the source of those concerns. Expected return Standard deviation Correlation to Current Strategy Current Strategy Strategy A B 7.00% 7.40% 6.50% 6.00% 7.00% 5.60% 1.00 -0.10 0.20 Strategy 7.80% 6.20% 0.40 Simulation Results sorted from Best to Worst Outcome Simulation 10,000 9.990 9,980 9.979 9,978 9,977 9,976 9,975 9,974 9,973 9,972 9.971 Current (141.66) (101.19) (90.06) (80.15) (71.33) 163.49 (56.50 (54.36) (52.29 (50.30) (48.39) 146.55) Current with A (96.52) (68.94) (61.36) (54.61) (48.60) 143.25) (38.50) (37.03) (35.63) (34.27) (32.97 (31.72) Current With B (111.39) 79.57 (70.81) 163.02) 56.09 (49.92 (44.43) (42.74 (41.12) (39.55 (38.05 (36.60) Current With (114.72 (81.94 72.93) (64.90 57.76 (5141 145.75 144.02) (42.34 (40.73 (39.19 (37.70) Strategy Simulation Results sorted from Best to Worst Outcome Simulation 10,000 9,990 9,980 9,979 9,978 9,977 9,976 9,975 9,974 9,973 9,972 9,971 9,970 Current (141.66) (101.19) (90.06) (80.15) (71.33) (63.49) (56.50) (54.36) (52.29) (50.30) (48.39) (46.55) (44.78) Current With A (96.52) (68.94) (61.36) (54.61) (48.60) (43.25) (38.50) (37.03) (35.63) (34.27) (32.97) (31.72) (30.51) Current With B (111.39) (79.57) (70.81) (63.02) (56.09) (49.92) (44.43) (42.74) (41.12) (39.55) (38.05) (36.60) (35.21) Current with C (114.72) (81.94) (72.93) (64.90) (57.76) (51.41) (45.75) (44.02) (42.34)| (40.73) (39.19) (37.70) (36.26)
Step by Step Solution
There are 3 Steps involved in it

Get step-by-step solutions from verified subject matter experts