

Question: Variables Variable names are used as the column heading names in the dataset Annual Food 1 Spending ($) 2 8909 3 5684 4 4 10706
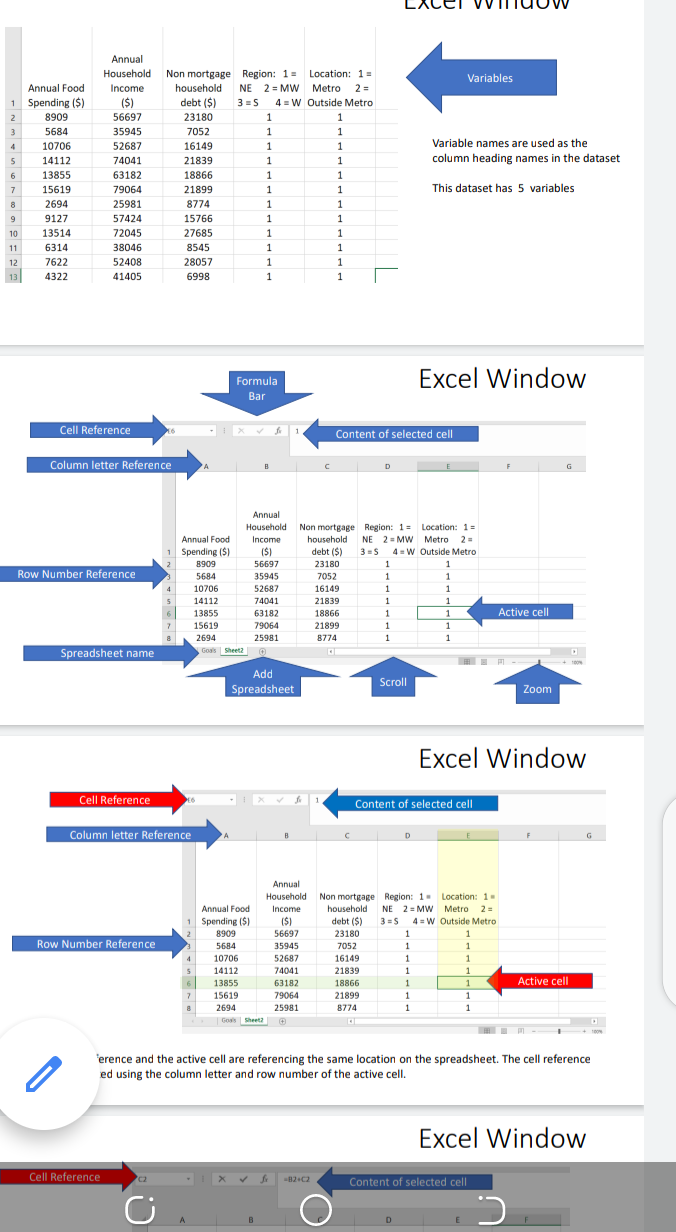
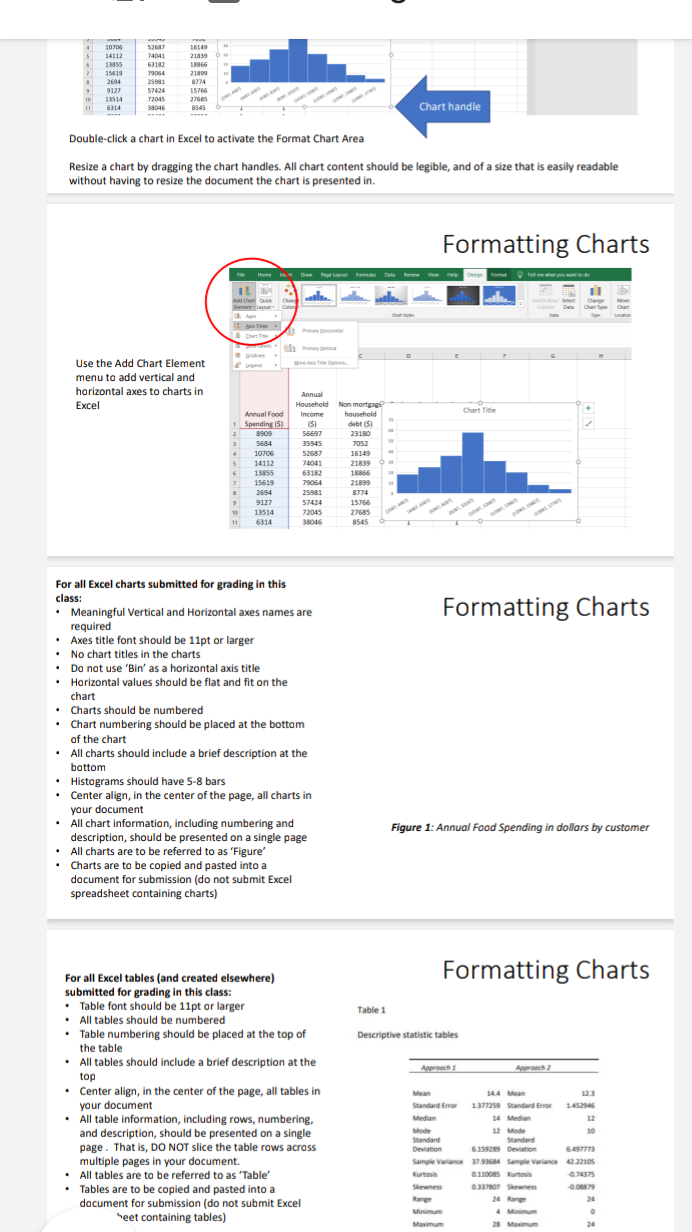
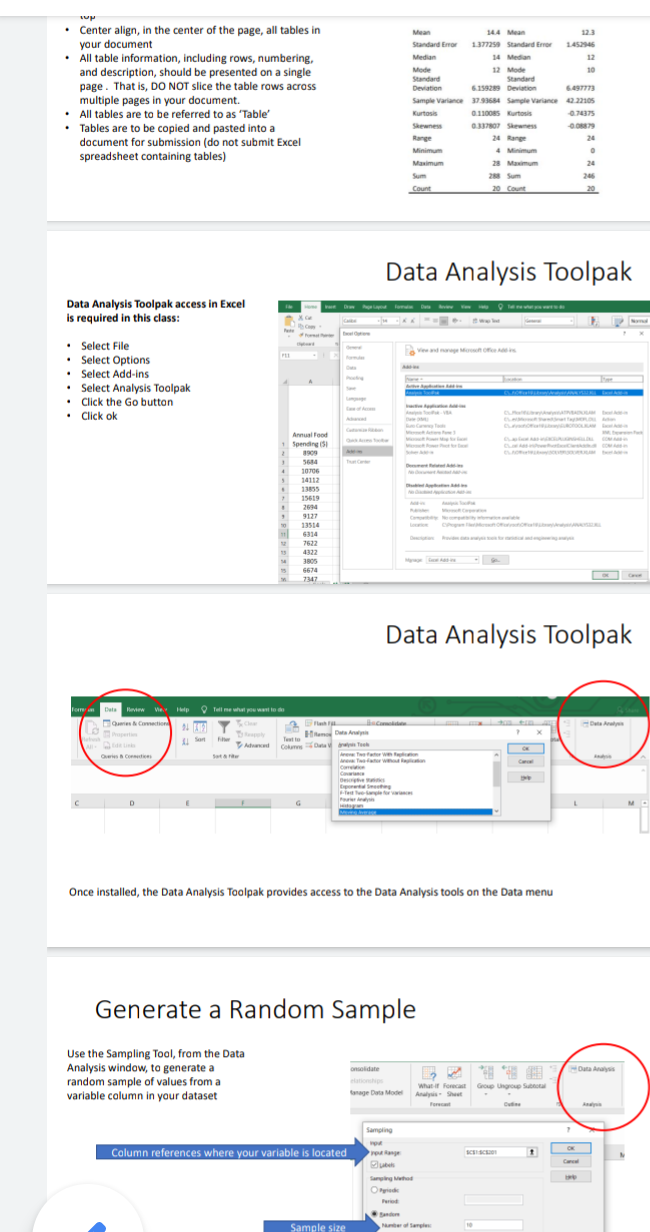
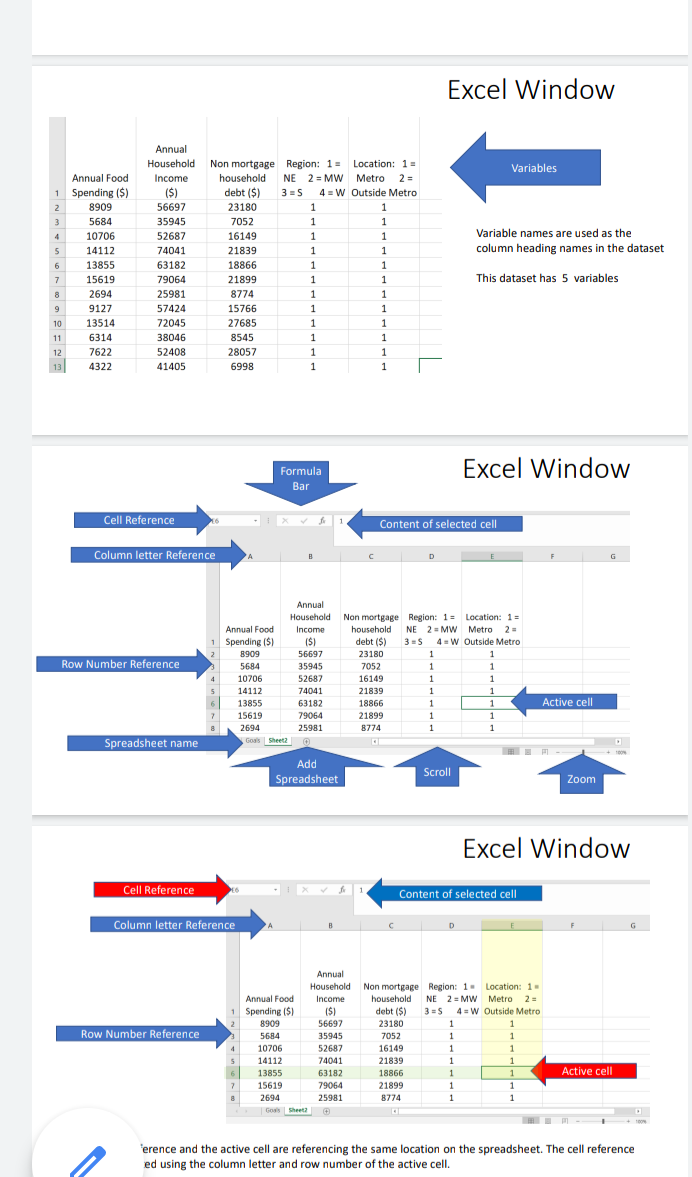
Variables Variable names are used as the column heading names in the dataset Annual Food 1 Spending ($) 2 8909 3 5684 4 4 10706 5 14112 6 13855 7. 15619 8 2694 9 9127 10 13514 11 6314 12 7622 13 4322 Annual Household Income ($) $ 56697 35945 52687 74041 63182 79064 25981 57424 72045 38046 52408 41405 Non mortgage Region: 1 = Location: 1 household NE 2 = MW Metro 2 = = debt ($) 3=S 4-W Outside Metro 23180 1 1 7052 1 1 16149 1 1 21839 1 1 18866 1 1 21899 1 1 8774 1 1 15766 1 1 27685 1 1 8545 1 1 28057 1 1 1 6998 1 1 This dataset has 5 variables Formula Bar Excel Window Cell Reference Content of selected cell Column letter Reference D G Row Number Reference Annual Household Annual Food Income Spending (5) ($) $ 8909 56697 5684 35945 10706 52687 14112 74041 13855 63182 15619 79064 2694 25981 Goals Sheet2 Non mortgage Region: 1: Location: 1 = household NE 2 = MW Metro 2 = debt ($) 35 4 =W Outside Metro 23180 1 1 7052 1 1 16149 1 1 21839 1 1 18866 1 1 21899 1 1 8774 1 1 Active cell Spreadsheet name Add Spreadsheet Scroll Zoom Excel Window Cell Reference 1 Content of selected cell Column letter Reference B D G Row Number Reference Annual Household Non mortgage Region: 1. Location: 1 Annual Food Income household NE 2 = MW Metro 2 = Spending (5) ( $i debt ($) 3=S 4 = W Outside Metro 8909 56697 23180 1 5684 35945 7052 1 10706 52687 16149 1 1 14112 74041 21839 1 1 13855 63182 18866 1 1 15619 79064 21899 1 1 2694 25981 8774 1 1 Goals Sheet Active cell 'erence and the active cell are referencing the same location on the spreadsheet. The cell reference ed using the column letter and row number of the active cell. Excel Window Cell Reference 02 -12.02 Content of selected cell o B D E 30700 14112 13955 15419 2634 9127 10 1114 6314 52 74041 63182 7906 25501 57424 72015 38046 GLAS 21839 1866 212 8774 15766 265 8545 Chart handle Double-click a chart in Excel to activate the Format Chart Area Resize a chart by dragging the chart handles. All chart content should be legible, and of a size that is easily readable without having to resize the document the chart is presented in. Formatting Charts Home Dr Page Layout Dr Mage Layout fatete View More Use the Add Chart Element menu to add vertical and horizontal axes to charts in Excel Chart Title Annual Food + ) Spending 15) 8909 5684 10706 5 14112 6 13855 7 15619 2694 9 9 9127 10 13514 11 6314 Annual Household Non marting Income household (5) debt 56697 23180 35945 7052 52587 16149 74041 21819 63182 18866 78064 21890 25981 8774 57424 15766 72045 27685 38046 8545 Formatting Charts For all Excel charts submitted for grading in this class: Meaningful Vertical and Horizontal axes names are required Axes title font should be 11pt or larger No chart titles in the charts Do not use 'Bin' as a horizontal axis title Horizontal values should be flat and fit on the chart Charts should be numbered Chart numbering should be placed at the bottom of the chart All charts should include a brief description at the bottom Histograms should have 5-8 bars Center align, in the center of the page, all charts in your document All chart information, including numbering and description, should be presented on a single page All charts are to be referred to as 'Figure' Charts are to be copied and pasted into a document for submission (do not submit Excel spreadsheet containing charts) Figure 1: Annual Food Spending in dollars by customer Formatting Charts Table 1 Descriptive statistic tables Art For all Excel tables and created elsewhere) submitted for grading in this class: Table font should be 11pt or larger All tables should be numbered Table numbering should be placed at the top of the table All tables should include a brief description at the top Center align, in the center of the page, all tables in your document All table information, including rows, numbering, and description, should be presented on a single page. That is, DO NOT slice the table rows across multiple pages in your document. All tables are to be referred to as 'Table Tables are to be copied and pasted into a document for submission (do not submit Excel "eet containing tables) Sandro Mean 144 Mean 123 1377250 Standard Error 145245 Median 14 Median M 12 Mode 12 Mode 10 Standard Standard Deviation 6.159289 Devotion 6.497773 Sample Variance 37.93584 Sample Variance 42.22105 Kurtois 0.110085 Euro Skewness 0:337807 Shwe Range 24 Range Minimum Maximum 28 Mam 24 WP Center align, in the center of the page, all tables in your document All table information, including rows, numbering, and description, should be presented on a single page. That is, DO NOT slice the table rows across multiple pages in your document. All tables are to be referred to as 'Table' Tables are to be copied and pasted into a document for submission (do not submit Excel spreadsheet containing tables) 14.4 Men 123 Standard Error 1377258 Standard Error 1.452346 Median 14 Media 12 Mode 12 Mode 10 Standard Standard Deviation 6.259289 Deviation 6.497773 Sample Variance 37.93684 Sample Variance 4222105 Kurtois 0.110085 Curtis 7037 0.337807 Skewness Rang 24 Range 24 Minimum o Maximum 28 Maximum 24 245 Count 20 Count 20 Data Analysis Toolpak Data Analysis Toolpak access in Excel is required in this class: Select File . Select Options Select Add-ins Select Analysis Toalpak Click the Go button . Click ok Annual Food Spending 15 1909 5684 10706 14112 13855 15619 2514 9127 13514 6314 7622 4322 3805 6674 7347 Data Analysis Toolpak www. ve pull me what you want to do -D www Home Data CD Sot w De D Once installed, the Data Analysis Toalpak provides access to the Data Analysis tools on the Data menu Generate a Random Sample Use the Sampling Tool, from the Data Analysis window, to generate a random sample of values from a variable column in your dataset -Out What Forecast Anh GOL Ungu age Data Sampling Column references where your variable is located SCCL Sanging the Ode Sample size Mateo Sarges Excel Window Variables Variable names are used as the column heading names in the dataset Annual Food 1 Spending ($) 2 2 8909 3 3 5684 4 10706 5 5 14112 6 13855 7 15619 8 2694 9 9127 10 13514 11 6314 12 7622 13 4322 Annual Household Non mortgage Region: 1 = = Location: 1 = 1 Income household NE 2 = MW Metro 2 = 2 = ($) debt ($) 3=S 4 =W Outside Metro 56697 23180 1 1 35945 7052 1 1 52687 16149 1 1 74041 21839 1 1 1 63182 18866 1 1 1 79064 21899 1 1 1 25981 8774 1 1 57424 15766 1 1 1 72045 27685 1 1 38046 8545 1 1 1 52408 28057 1 1 41405 6998 1 1 This dataset has 5 variables Formula Bar Excel Window Cell Reference X 1 Content of selected cell Column letter Reference D Row Number Reference Annual Food Spending ($) 8909 5684 10706 14112 13855 15619 2694 Goals Sheet2 Annual Household Non mortgage Region: 1 = Location: 1 Income household NE 2 = MW Metro 2 2 - ($1 debt ($) 3= 4 =W Outside Metro 56697 23180 1 1 35945 7052 1 1 52687 16149 1 1 1 74041 21839 1 1 1 63182 18866 1 1 79064 21899 1 1 25981 8774 1 1 Active cell Spreadsheet name Add Spreadsheet Scroll Zoom Excel Window Cell Reference 1 Content of selected cell Column letter Reference D D G Row Number Reference Annual Household Non mortgage Region: 1. Location: 1 Annual Food Income household NE 2 = MW Metro 2 = 2 Spending (8) ($) debt ($) 3 = 5 4 = W Outside Metro 8909 56697 23180 1 1 5684 35945 7052 1 1 10706 52687 16149 1 1 14112 74041 21839 1 1 13855 63182 18866 1 1 1 15619 79064 21899 1 1 1 2694 25981 8774 1 1 Goals Sheet 5 Active cell 6 7 8 ference and the active cell are referencing the same location on the spreadsheet. The cell reference ed using the column letter and row number of the active cell. Variables Variable names are used as the column heading names in the dataset Annual Food 1 Spending ($) 2 8909 3 5684 4 4 10706 5 14112 6 13855 7. 15619 8 2694 9 9127 10 13514 11 6314 12 7622 13 4322 Annual Household Income ($) $ 56697 35945 52687 74041 63182 79064 25981 57424 72045 38046 52408 41405 Non mortgage Region: 1 = Location: 1 household NE 2 = MW Metro 2 = = debt ($) 3=S 4-W Outside Metro 23180 1 1 7052 1 1 16149 1 1 21839 1 1 18866 1 1 21899 1 1 8774 1 1 15766 1 1 27685 1 1 8545 1 1 28057 1 1 1 6998 1 1 This dataset has 5 variables Formula Bar Excel Window Cell Reference Content of selected cell Column letter Reference D G Row Number Reference Annual Household Annual Food Income Spending (5) ($) $ 8909 56697 5684 35945 10706 52687 14112 74041 13855 63182 15619 79064 2694 25981 Goals Sheet2 Non mortgage Region: 1: Location: 1 = household NE 2 = MW Metro 2 = debt ($) 35 4 =W Outside Metro 23180 1 1 7052 1 1 16149 1 1 21839 1 1 18866 1 1 21899 1 1 8774 1 1 Active cell Spreadsheet name Add Spreadsheet Scroll Zoom Excel Window Cell Reference 1 Content of selected cell Column letter Reference B D G Row Number Reference Annual Household Non mortgage Region: 1. Location: 1 Annual Food Income household NE 2 = MW Metro 2 = Spending (5) ( $i debt ($) 3=S 4 = W Outside Metro 8909 56697 23180 1 5684 35945 7052 1 10706 52687 16149 1 1 14112 74041 21839 1 1 13855 63182 18866 1 1 15619 79064 21899 1 1 2694 25981 8774 1 1 Goals Sheet Active cell 'erence and the active cell are referencing the same location on the spreadsheet. The cell reference ed using the column letter and row number of the active cell. Excel Window Cell Reference 02 -12.02 Content of selected cell o B D E 30700 14112 13955 15419 2634 9127 10 1114 6314 52 74041 63182 7906 25501 57424 72015 38046 GLAS 21839 1866 212 8774 15766 265 8545 Chart handle Double-click a chart in Excel to activate the Format Chart Area Resize a chart by dragging the chart handles. All chart content should be legible, and of a size that is easily readable without having to resize the document the chart is presented in. Formatting Charts Home Dr Page Layout Dr Mage Layout fatete View More Use the Add Chart Element menu to add vertical and horizontal axes to charts in Excel Chart Title Annual Food + ) Spending 15) 8909 5684 10706 5 14112 6 13855 7 15619 2694 9 9 9127 10 13514 11 6314 Annual Household Non marting Income household (5) debt 56697 23180 35945 7052 52587 16149 74041 21819 63182 18866 78064 21890 25981 8774 57424 15766 72045 27685 38046 8545 Formatting Charts For all Excel charts submitted for grading in this class: Meaningful Vertical and Horizontal axes names are required Axes title font should be 11pt or larger No chart titles in the charts Do not use 'Bin' as a horizontal axis title Horizontal values should be flat and fit on the chart Charts should be numbered Chart numbering should be placed at the bottom of the chart All charts should include a brief description at the bottom Histograms should have 5-8 bars Center align, in the center of the page, all charts in your document All chart information, including numbering and description, should be presented on a single page All charts are to be referred to as 'Figure' Charts are to be copied and pasted into a document for submission (do not submit Excel spreadsheet containing charts) Figure 1: Annual Food Spending in dollars by customer Formatting Charts Table 1 Descriptive statistic tables Art For all Excel tables and created elsewhere) submitted for grading in this class: Table font should be 11pt or larger All tables should be numbered Table numbering should be placed at the top of the table All tables should include a brief description at the top Center align, in the center of the page, all tables in your document All table information, including rows, numbering, and description, should be presented on a single page. That is, DO NOT slice the table rows across multiple pages in your document. All tables are to be referred to as 'Table Tables are to be copied and pasted into a document for submission (do not submit Excel "eet containing tables) Sandro Mean 144 Mean 123 1377250 Standard Error 145245 Median 14 Median M 12 Mode 12 Mode 10 Standard Standard Deviation 6.159289 Devotion 6.497773 Sample Variance 37.93584 Sample Variance 42.22105 Kurtois 0.110085 Euro Skewness 0:337807 Shwe Range 24 Range Minimum Maximum 28 Mam 24 WP Center align, in the center of the page, all tables in your document All table information, including rows, numbering, and description, should be presented on a single page. That is, DO NOT slice the table rows across multiple pages in your document. All tables are to be referred to as 'Table' Tables are to be copied and pasted into a document for submission (do not submit Excel spreadsheet containing tables) 14.4 Men 123 Standard Error 1377258 Standard Error 1.452346 Median 14 Media 12 Mode 12 Mode 10 Standard Standard Deviation 6.259289 Deviation 6.497773 Sample Variance 37.93684 Sample Variance 4222105 Kurtois 0.110085 Curtis 7037 0.337807 Skewness Rang 24 Range 24 Minimum o Maximum 28 Maximum 24 245 Count 20 Count 20 Data Analysis Toolpak Data Analysis Toolpak access in Excel is required in this class: Select File . Select Options Select Add-ins Select Analysis Toalpak Click the Go button . Click ok Annual Food Spending 15 1909 5684 10706 14112 13855 15619 2514 9127 13514 6314 7622 4322 3805 6674 7347 Data Analysis Toolpak www. ve pull me what you want to do -D www Home Data CD Sot w De D Once installed, the Data Analysis Toalpak provides access to the Data Analysis tools on the Data menu Generate a Random Sample Use the Sampling Tool, from the Data Analysis window, to generate a random sample of values from a variable column in your dataset -Out What Forecast Anh GOL Ungu age Data Sampling Column references where your variable is located SCCL Sanging the Ode Sample size Mateo Sarges Excel Window Variables Variable names are used as the column heading names in the dataset Annual Food 1 Spending ($) 2 2 8909 3 3 5684 4 10706 5 5 14112 6 13855 7 15619 8 2694 9 9127 10 13514 11 6314 12 7622 13 4322 Annual Household Non mortgage Region: 1 = = Location: 1 = 1 Income household NE 2 = MW Metro 2 = 2 = ($) debt ($) 3=S 4 =W Outside Metro 56697 23180 1 1 35945 7052 1 1 52687 16149 1 1 74041 21839 1 1 1 63182 18866 1 1 1 79064 21899 1 1 1 25981 8774 1 1 57424 15766 1 1 1 72045 27685 1 1 38046 8545 1 1 1 52408 28057 1 1 41405 6998 1 1 This dataset has 5 variables Formula Bar Excel Window Cell Reference X 1 Content of selected cell Column letter Reference D Row Number Reference Annual Food Spending ($) 8909 5684 10706 14112 13855 15619 2694 Goals Sheet2 Annual Household Non mortgage Region: 1 = Location: 1 Income household NE 2 = MW Metro 2 2 - ($1 debt ($) 3= 4 =W Outside Metro 56697 23180 1 1 35945 7052 1 1 52687 16149 1 1 1 74041 21839 1 1 1 63182 18866 1 1 79064 21899 1 1 25981 8774 1 1 Active cell Spreadsheet name Add Spreadsheet Scroll Zoom Excel Window Cell Reference 1 Content of selected cell Column letter Reference D D G Row Number Reference Annual Household Non mortgage Region: 1. Location: 1 Annual Food Income household NE 2 = MW Metro 2 = 2 Spending (8) ($) debt ($) 3 = 5 4 = W Outside Metro 8909 56697 23180 1 1 5684 35945 7052 1 1 10706 52687 16149 1 1 14112 74041 21839 1 1 13855 63182 18866 1 1 1 15619 79064 21899 1 1 1 2694 25981 8774 1 1 Goals Sheet 5 Active cell 6 7 8 ference and the active cell are referencing the same location on the spreadsheet. The cell reference ed using the column letter and row number of the active cell
Step by Step Solution
There are 3 Steps involved in it

Get step-by-step solutions from verified subject matter experts