

Question: Variance Analysis : Prepare the data in the Variances tab to determine whether the variances are favorable or unfavorable. Remember to show your work using
- Variance Analysis: Prepare the data in the Variances tab to determine whether the variances are favorable or unfavorable. Remember to show your work using calculations to the side of the table or using appropriate formulas in the table.
- Complete the data table for the variances by entering the budgeted (standard) and actual labor and material values. Remember to use the estimates for expected sales from your Milestone Two assignment.
- Determine the variances for direct labor and direct materials in the Variances tab.
- Evaluate the significance of the variances in the Variances tab, and mark them as favorable or unfavorable.
- Income Statement: Use the given revenue data to prepare the Income Statement tab table and calculate the net income. Remember to show your work using calculations to the side of the table or using appropriate formulas in the table.
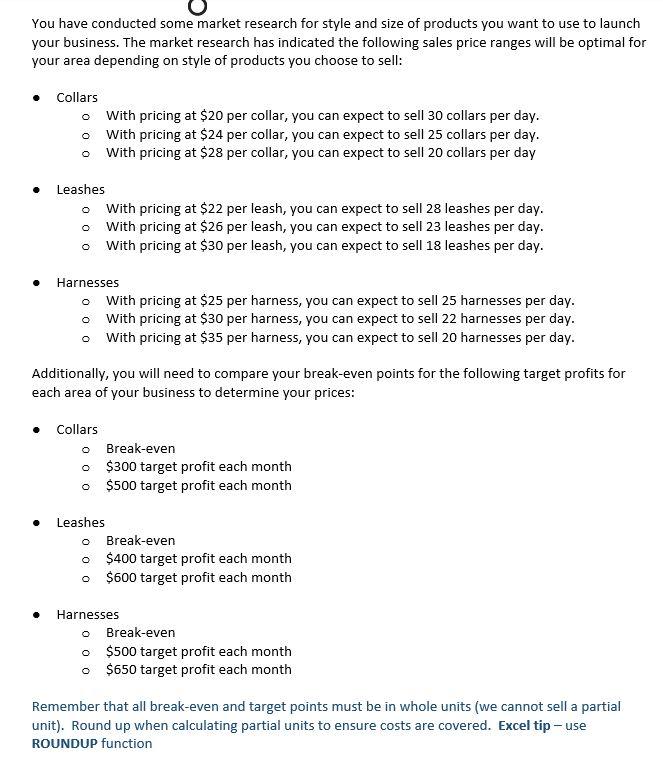

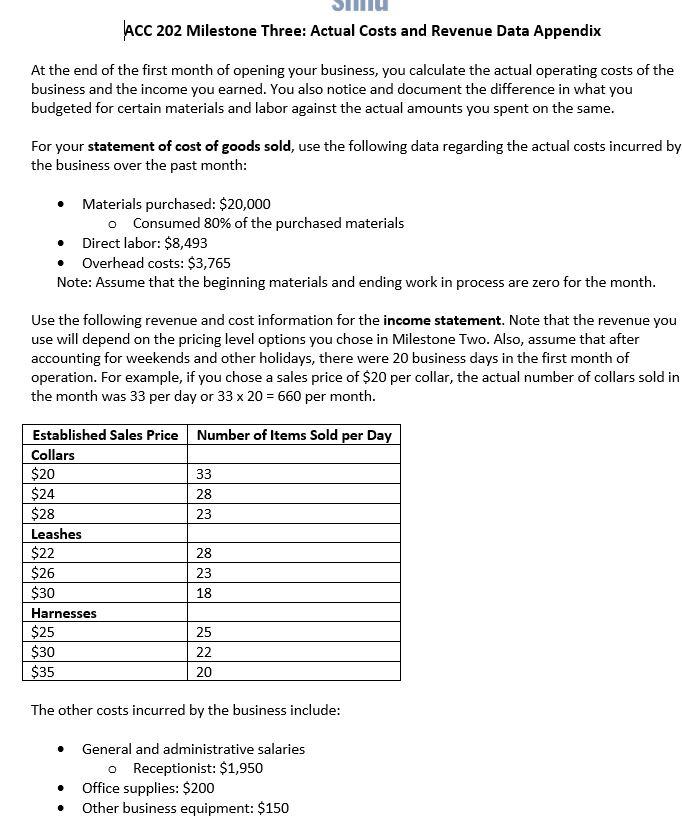
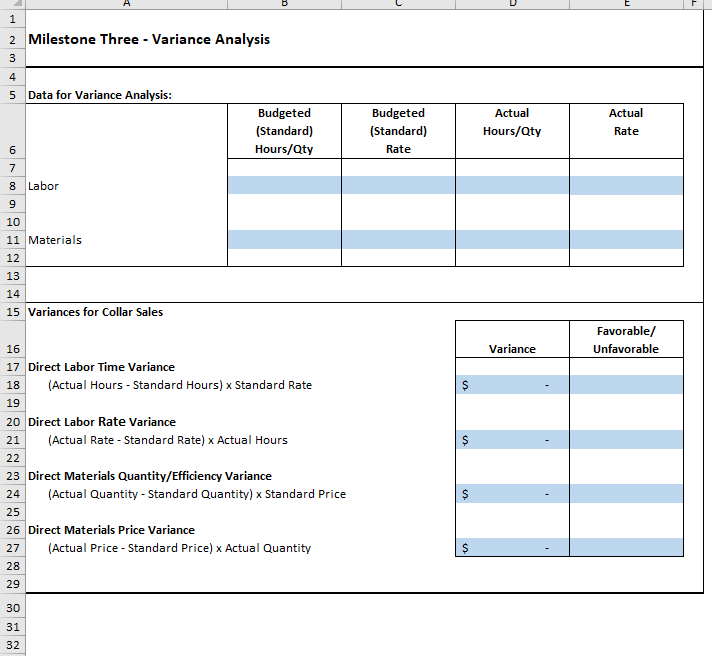
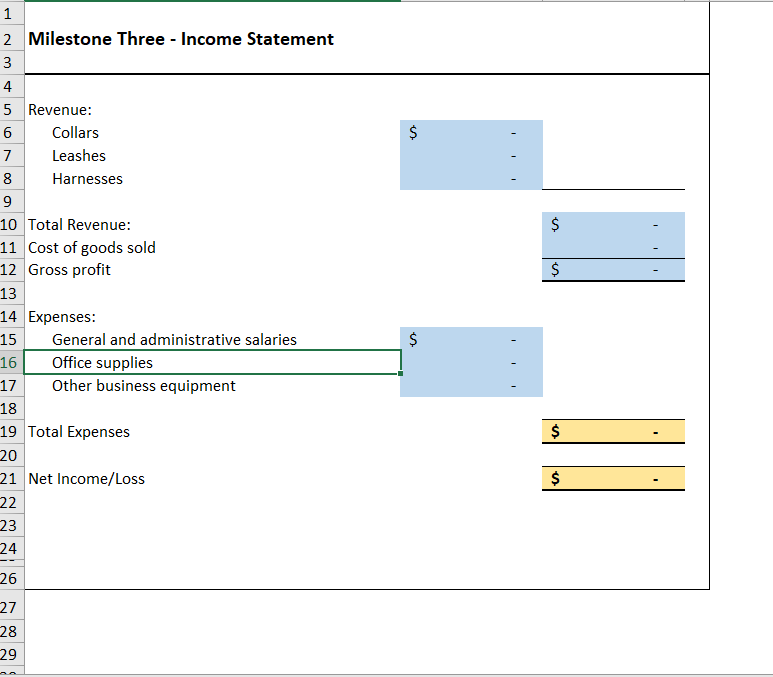
You have conducted some market research for style and size of products you want to use to launch your business. The market research has indicated the following sales price ranges will be optimal for your area depending on style of products you choose to sell: Collars o With pricing at $20 per collar, you can expect to sell 30 collars per day. o With pricing at $24 per collar, you can expect to sell 25 collars per day. o With pricing at $28 per collar, you can expect to sell 20 collars per day Leashes o With pricing at $22 per leash, you can expect to sell 28 leashes per day. o With pricing at $26 per leash, you can expect to sell 23 leashes per day. o With pricing at $30 per leash, you can expect to sell 18 leashes per day. Harnesses o With pricing at $25 per harness, you can expect to sell 25 harnesses per day. o With pricing at $30 per harness, you can expect to sell 22 harnesses per day. o With pricing at $35 per harness, you can expect to sell 20 harnesses per day. Additionally, you will need to compare your break-even points for the following target profits for each area of your business to determine your prices: 0 Collars Break-even o $300 target profit each month o $500 target profit each month Leashes o Break-even o $400 target profit each month o $600 target profit each month o Harnesses Break-even o $500 target profit each month o $650 target profit each month Remember that all break-even and target points must be in whole units (we cannot sell a partial unit). Round up when calculating partial units to ensure costs are covered. Excel tip - use ROUNDUP function ACC 202 Milestone Three: Actual Costs and Revenue Data Appendix At the end of the first month of opening your business, you calculate the actual operating costs of the business and the income you earned. You also notice and document the difference in what you budgeted for certain materials and labor against the actual amounts you spent on the same. For your statement of cost of goods sold, use the following data regarding the actual costs incurred by the business over the past month: Materials purchased: $20,000 o Consumed 80% of the purchased materials Direct labor: $8,493 Overhead costs: $3,765 Note: Assume that the beginning materials and ending work in process are zero for the month. Use the following revenue and cost information for the income statement. Note that the revenue you use will depend on the pricing level options you chose in Milestone Two. Also, assume that after accounting for weekends and other holidays, there were 20 business days in the first month of operation. For example, if you chose a sales price of $20 per collar, the actual number of collars sold in the month was 33 per day or 33 x 20 = 660 per month. Established Sales Price Number of Items Sold per Day Collars $20 33 $24 28 $28 23 Leashes $22 28 $26 23 $30 18 Harnesses $25 25 $30 22 $35 20 The other costs incurred by the business include: . General and administrative salaries o Receptionist: $1,950 Office supplies: $200 Other business equipment: $150 . Budgeted (Standard) Rate Actual Hours/Qty Actual Rate 1 2 Milestone Three - Variance Analysis 3 4 5 Data for Variance Analysis: Budgeted (Standard) 6 Hours/Qty 7 8 Labor 9 10 11 Materials 12 13 14 15 Variances for Collar Sales Favorable/ Unfavorable 16 Variance 17 Direct Labor Time Variance 18 (Actual Hours - Standard Hours) x Standard Rate 19 20 Direct Labor Rate Variance 21 (Actual Rate - Standard Rate) x Actual Hours 22 23 Direct Materials Quantity/Efficiency Variance 24 (Actual Quantity - Standard Quantity) x Standard Price 25 26 Direct Materials Price Variance 27 (Actual Price - Standard Price) x Actual Quantity 28 29 30 31 32 $ 1 2 Milestone Three - Income Statement 3 4 5 Revenue: 6 Collars 7 Leashes 8 Harnesses 9 10 Total Revenue: 11 Cost of goods sold 12 Gross profit 13 14 Expenses: 15 General and administrative salaries Office supplies 17 Other business equipment 18 19 Total Expenses $ $ $ 16 $ 20 $ 21 Net Income/Loss 22 23 24 26 27 28 29
Step by Step Solution
There are 3 Steps involved in it

Get step-by-step solutions from verified subject matter experts