

Question: VARIANCE ANALYSIS Use Exhibits below to answer questions. Do variance analysis. Jenkins was finally driving home at 2 AM. She felt well equipped for the
VARIANCE ANALYSIS
Use Exhibits below to answer questions. Do variance analysis.
Jenkins was finally driving home at 2 AM. She felt well equipped for the meeting the next morning but wondered about other forms of analysis she might have done if she had more time. For example, Norton had been quite pleased with the growth in revenues and billed hours. But was that due to good work by the firm, or had the overall consulting industry grown faster than expected during the quarter. In other words, was Software Associates increasing or decreasing its share of software consulting business?
Also, Jenkins had assumed that operating expenses varied only with the number of consultants. She pondered whether the consultants from the Solutions business required more support than did the consultants in the Contract business. Also, did support expenses vary with the number of consultants, of either type, or with the number of hours they worked or billed?
Within each business line, she had used an average billing and cost rate per consultant. Would she get additional insights by looking at the mix of consultants used within each business or even on each job to understand better the economics of the business?
She resolved to think more about these issues in the upcoming quarter, but her most urgent task was to get some sleep before presenting her analysis to Richard Norton in a few hours.
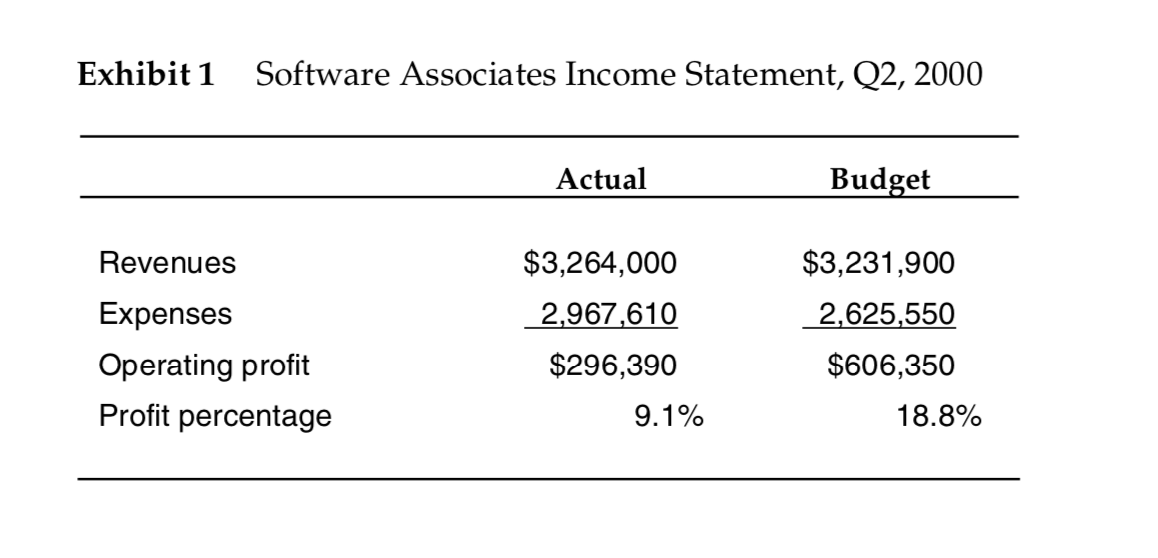
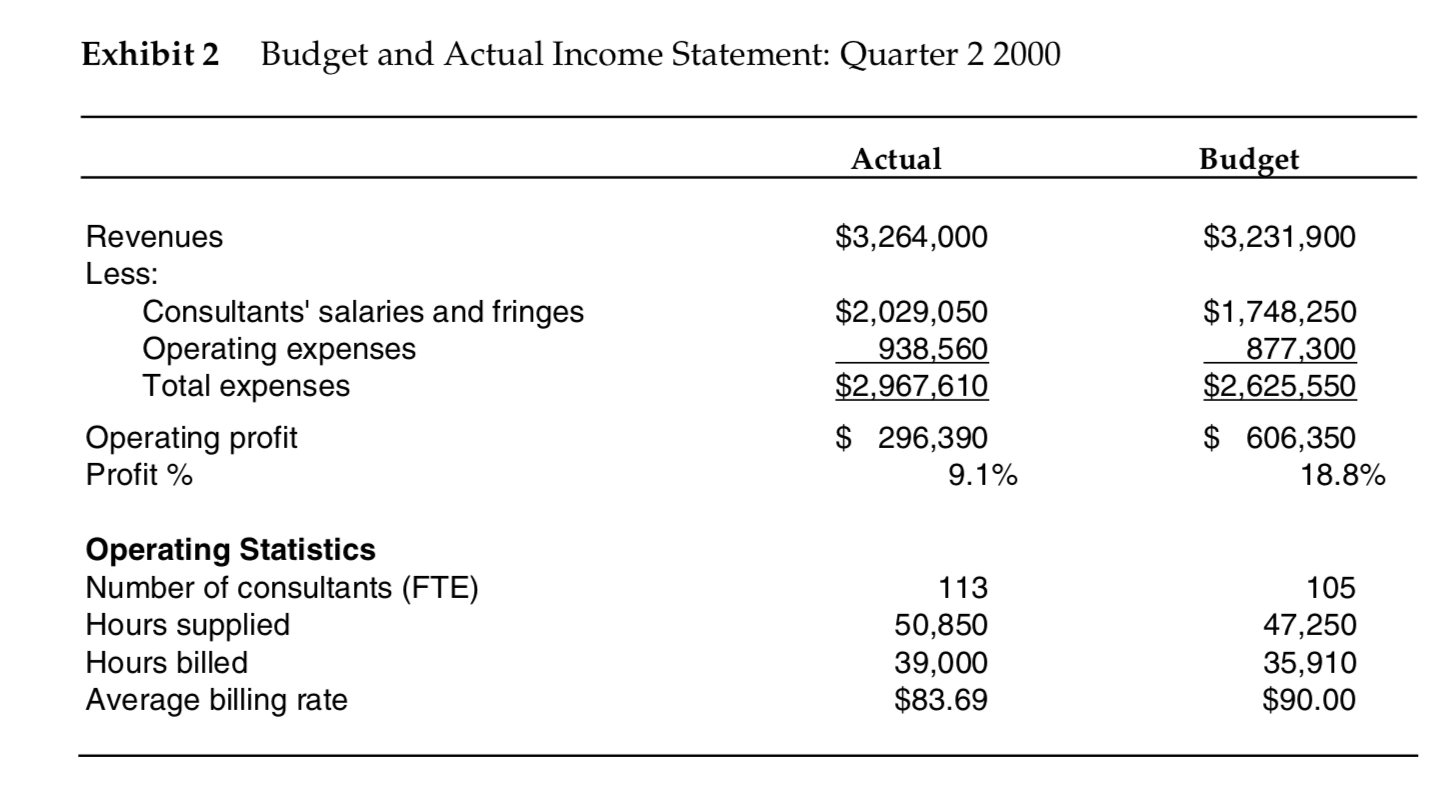
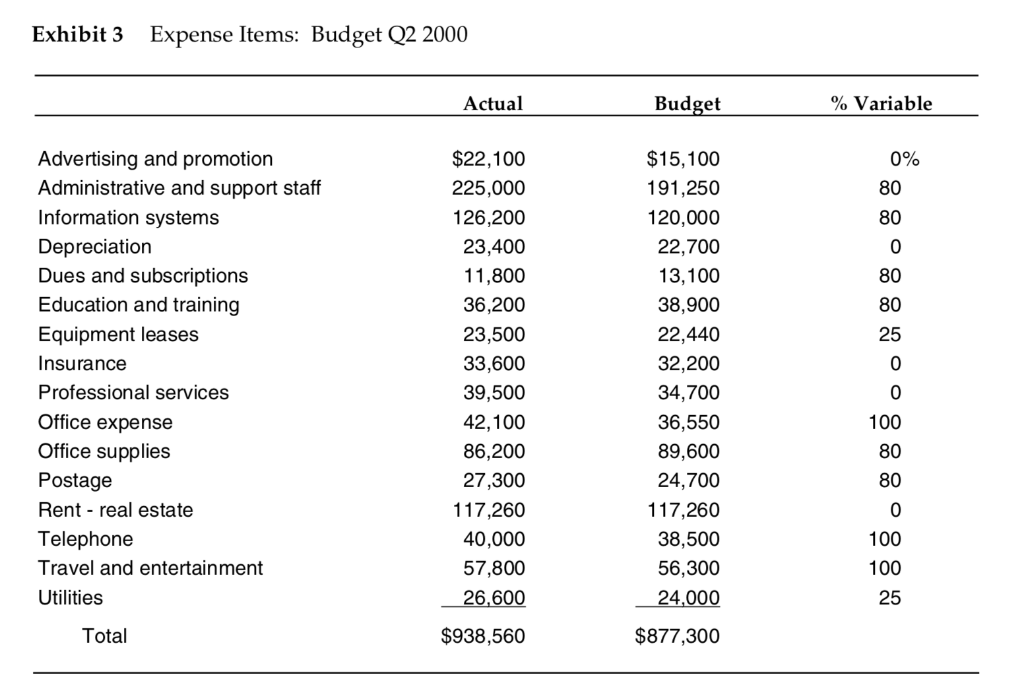
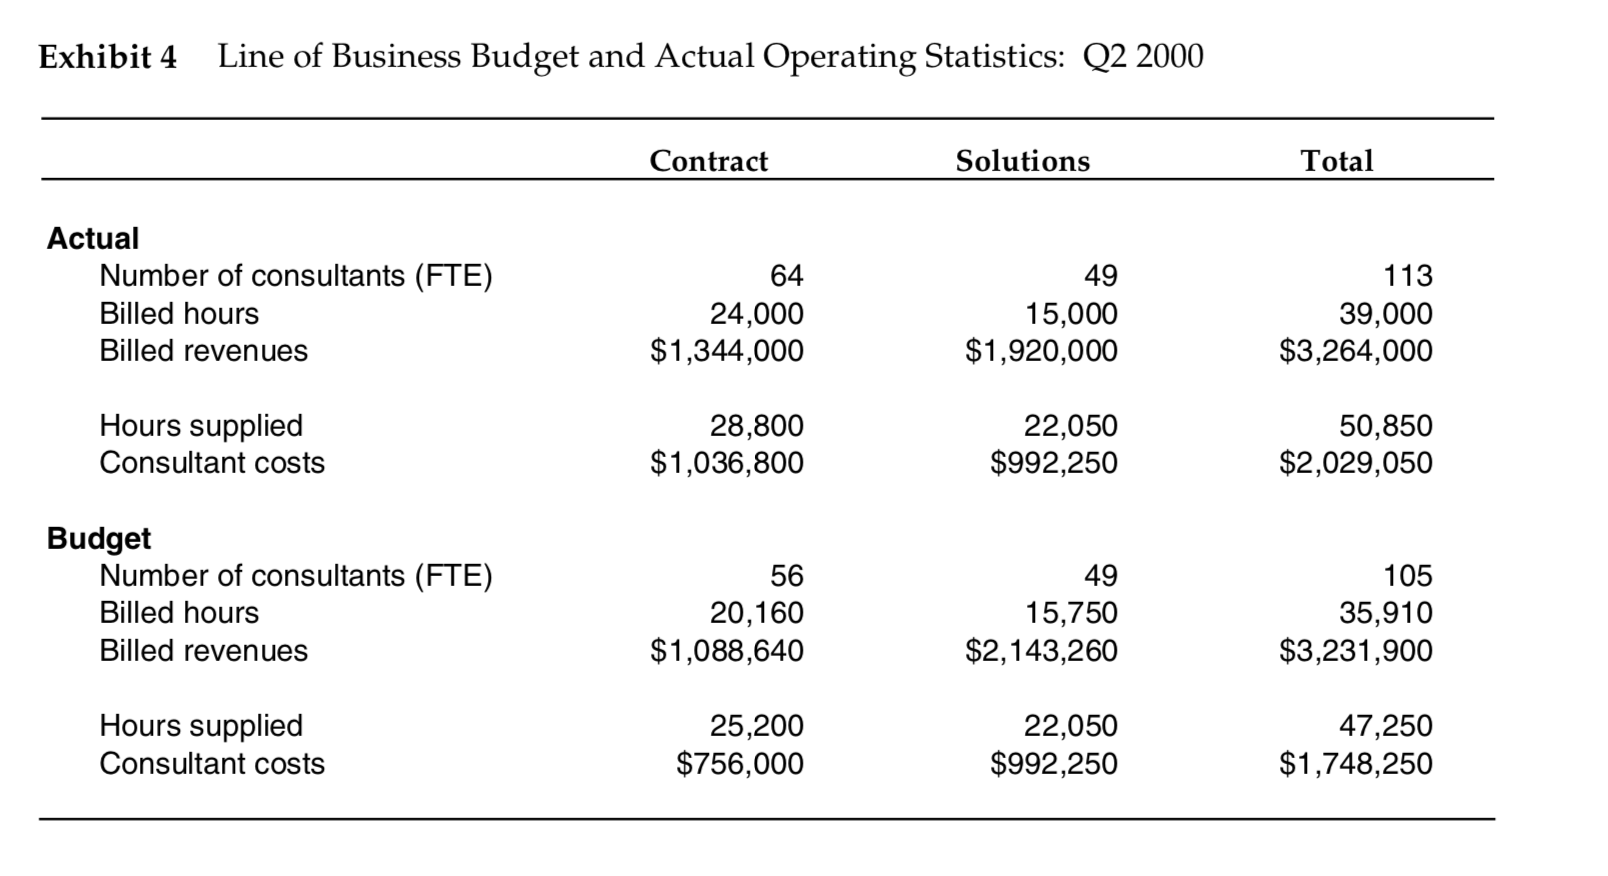
Exhibit 1 Software Associates Income Statement, Q2, 2000 Actual Budget Revenues Expenses Operating profit Profit percentage $3,264,000 2,967,610 $296,390 9.1% $3,231,900 2,625,550 $606,350 18.8% Exhibit 2 Budget and Actual Income Statement: Quarter 2 2000 Actual Budget $3,264,000 $3,231,900 Revenues Less: Consultants' salaries and fringes Operating expenses Total expenses Operating profit Profit % $2,029,050 938,560 $2,967,610 $ 296,390 9.1% $1,748,250 877.300 $2,625,550 $ 606,350 18.8% Operating Statistics Number of consultants (FTE) Hours supplied Hours billed Average billing rate 113 50,850 39,000 $83.69 105 47,250 35,910 $90.00 Exhibit 3 Expense Items: Budget Q2 2000 Actual Budget % Variable Advertising and promotion Administrative and support staff Information systems Depreciation Dues and subscriptions Education and training Equipment leases Insurance Professional services Office expense Office supplies Postage Rent - real estate Telephone Travel and entertainment Utilities $22,100 225,000 126,200 23,400 11,800 36,200 23,500 33,600 39,500 42,100 86,200 27,300 117,260 40,000 57,800 26,600 $938,560 $15,100 191,250 120,000 22,700 13,100 38,900 22,440 32,200 34,700 36,550 89,600 24,700 117,260 38,500 56,300 24.000 $877,300 Total Exhibit 4 Line of Business Budget and Actual Operating Statistics: Q2 2000 Contract Solutions Total Actual Number of consultants (FTE) Billed hours Billed revenues 64 24,000 $1,344,000 49 15,000 $1,920,000 113 39,000 $3,264,000 Hours supplied Consultant costs 28,800 $1,036,800 22,050 $992,250 50,850 $2,029,050 Budget Number of consultants (FTE) Billed hours Billed revenues 56 20,160 $1,088,640 49 15,750 $2,143,260 105 35,910 $3,231,900 Hours supplied Consultant costs 25,200 $756,000 22,050 $992,250 47,250 $1,748,250 Exhibit 1 Software Associates Income Statement, Q2, 2000 Actual Budget Revenues Expenses Operating profit Profit percentage $3,264,000 2,967,610 $296,390 9.1% $3,231,900 2,625,550 $606,350 18.8% Exhibit 2 Budget and Actual Income Statement: Quarter 2 2000 Actual Budget $3,264,000 $3,231,900 Revenues Less: Consultants' salaries and fringes Operating expenses Total expenses Operating profit Profit % $2,029,050 938,560 $2,967,610 $ 296,390 9.1% $1,748,250 877.300 $2,625,550 $ 606,350 18.8% Operating Statistics Number of consultants (FTE) Hours supplied Hours billed Average billing rate 113 50,850 39,000 $83.69 105 47,250 35,910 $90.00 Exhibit 3 Expense Items: Budget Q2 2000 Actual Budget % Variable Advertising and promotion Administrative and support staff Information systems Depreciation Dues and subscriptions Education and training Equipment leases Insurance Professional services Office expense Office supplies Postage Rent - real estate Telephone Travel and entertainment Utilities $22,100 225,000 126,200 23,400 11,800 36,200 23,500 33,600 39,500 42,100 86,200 27,300 117,260 40,000 57,800 26,600 $938,560 $15,100 191,250 120,000 22,700 13,100 38,900 22,440 32,200 34,700 36,550 89,600 24,700 117,260 38,500 56,300 24.000 $877,300 Total Exhibit 4 Line of Business Budget and Actual Operating Statistics: Q2 2000 Contract Solutions Total Actual Number of consultants (FTE) Billed hours Billed revenues 64 24,000 $1,344,000 49 15,000 $1,920,000 113 39,000 $3,264,000 Hours supplied Consultant costs 28,800 $1,036,800 22,050 $992,250 50,850 $2,029,050 Budget Number of consultants (FTE) Billed hours Billed revenues 56 20,160 $1,088,640 49 15,750 $2,143,260 105 35,910 $3,231,900 Hours supplied Consultant costs 25,200 $756,000 22,050 $992,250 47,250 $1,748,250
Step by Step Solution
There are 3 Steps involved in it

Get step-by-step solutions from verified subject matter experts