

Question: Variance and standard deviation. Calculate the variance and the standard deviation of U.S. Treasury bills, long-term government bonds, and small-company stocks for 1950 to 1959,
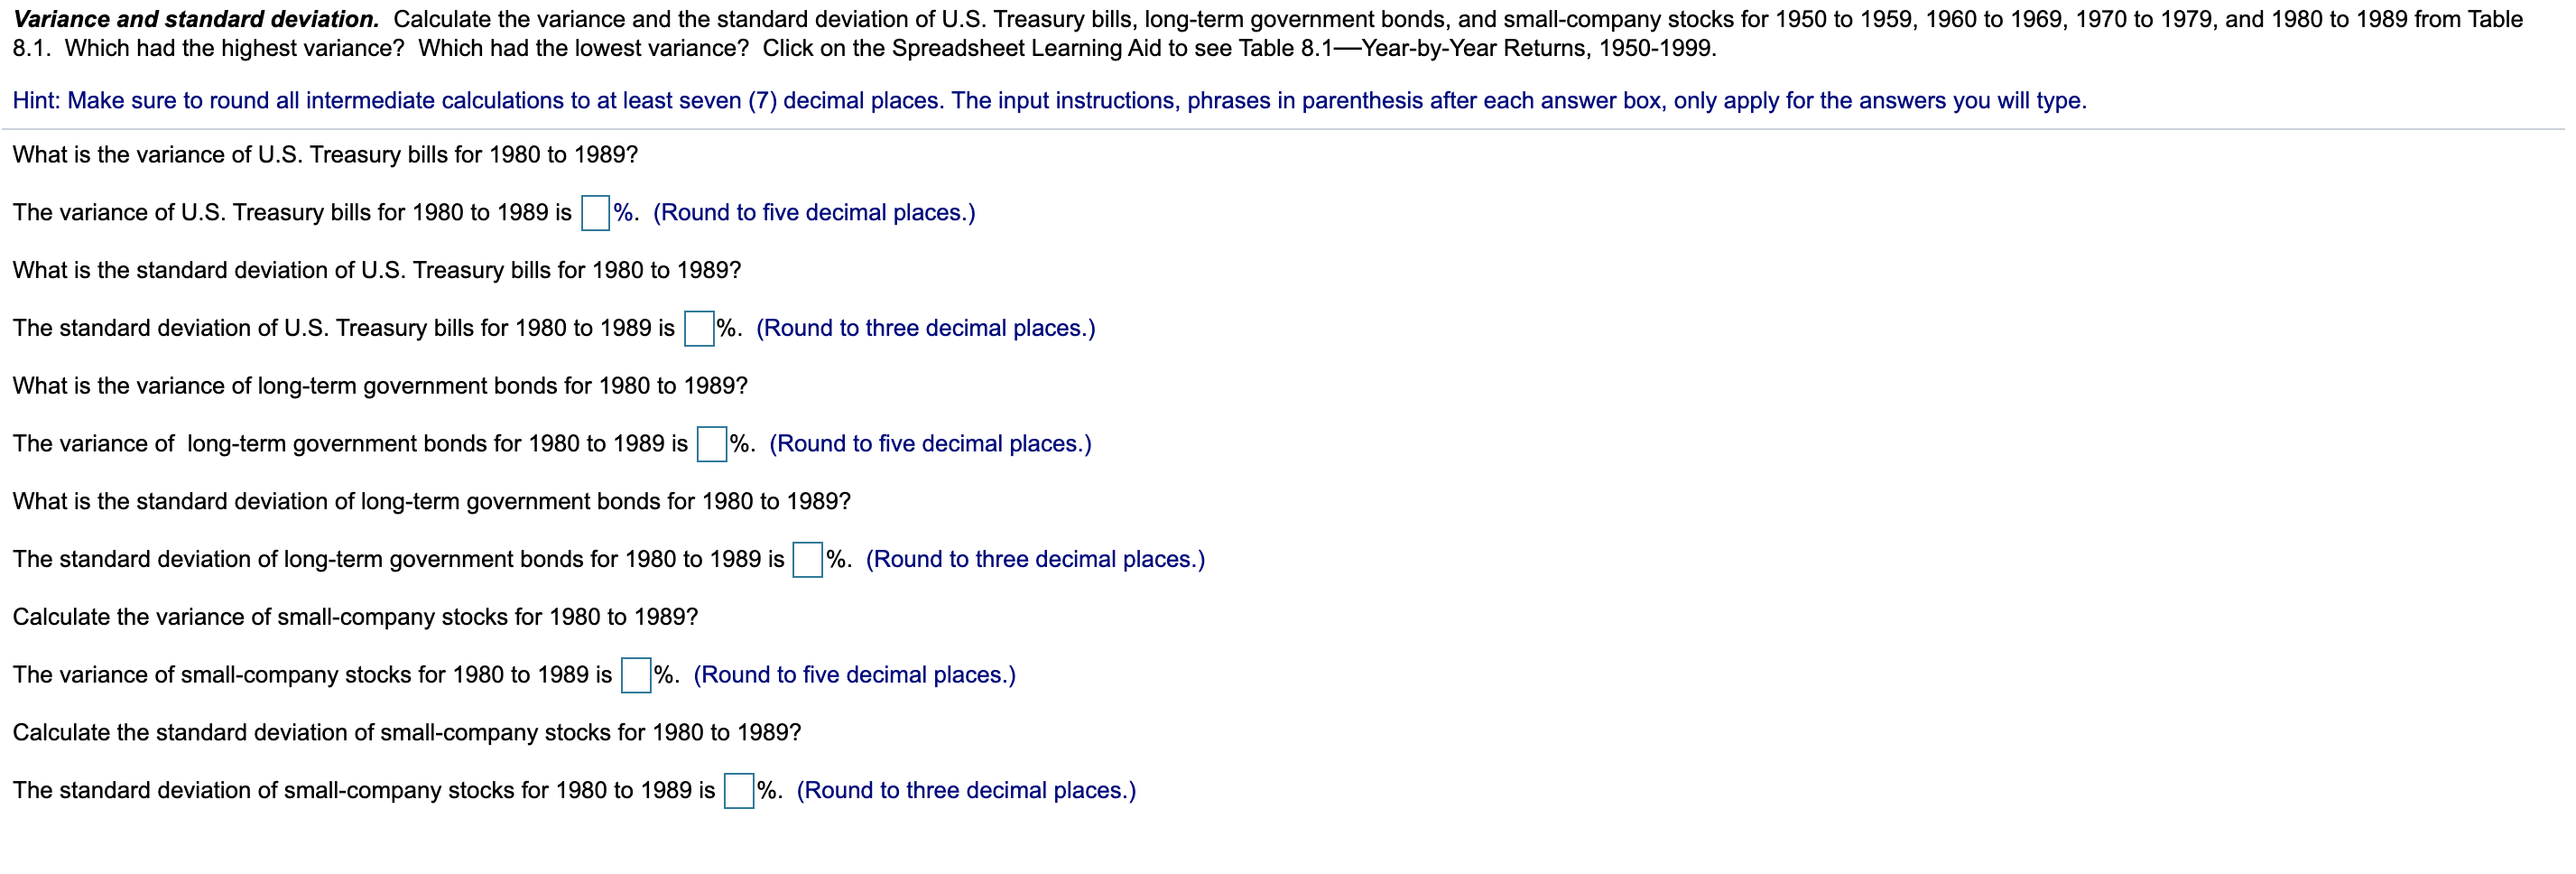
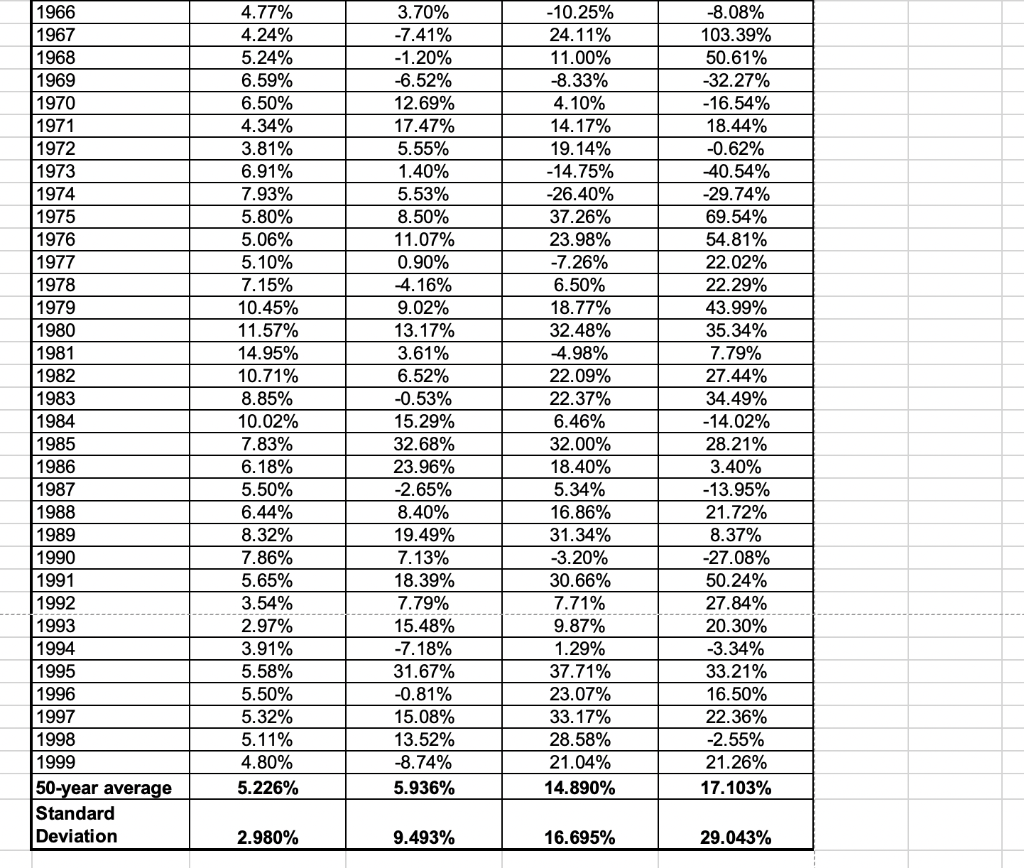
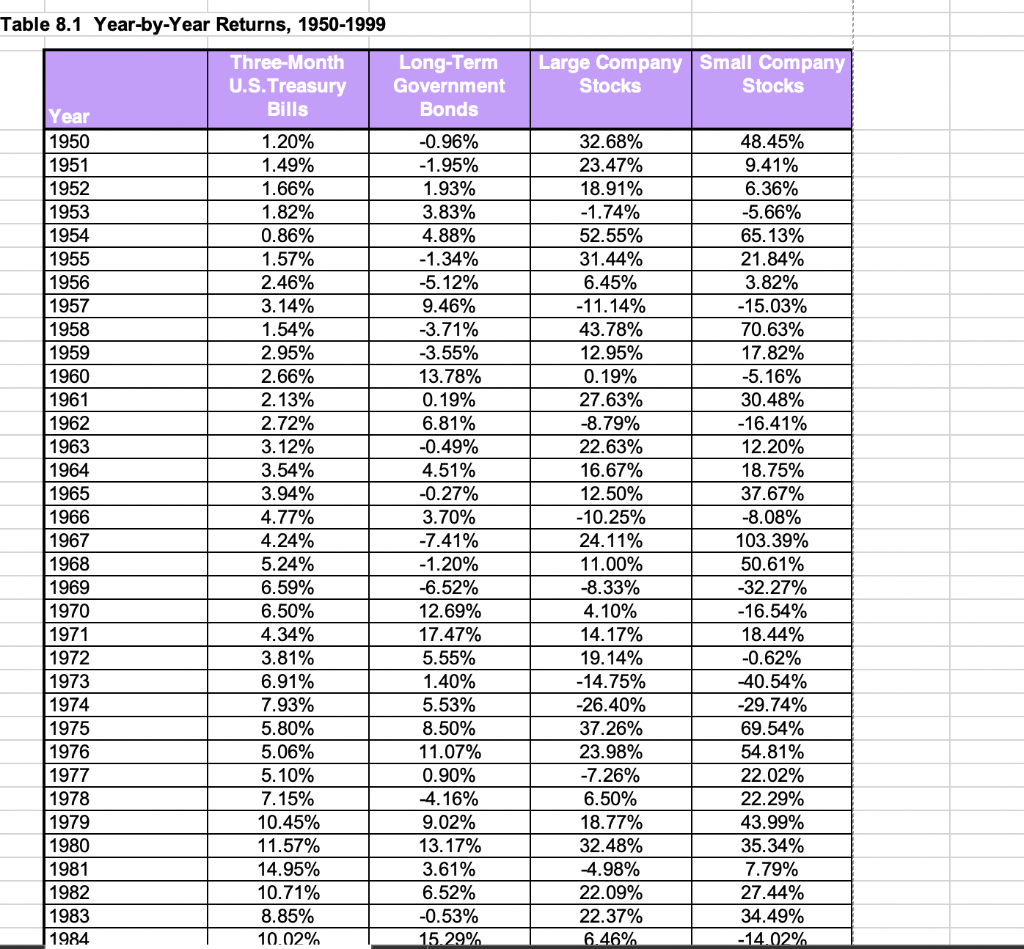
Variance and standard deviation. Calculate the variance and the standard deviation of U.S. Treasury bills, long-term government bonds, and small-company stocks for 1950 to 1959, 1960 to 1969, 1970 to 1979, and 1980 to 1989 from Table 8.1. Which had the highest variance? Which had the lowest variance? Click on the Spreadsheet Learning Aid to see Table 8.1Year-by-Year Returns, 1950-1999. Hint: Make sure to round all intermediate calculations to at least seven (7) decimal places. The input instructions, phrases in parenthesis after each answer box, only apply for the answers you will type. What is the variance of U.S. Treasury bills for 1980 to 1989? The variance of U.S. Treasury bills for 1980 to 1989 is (%. (Round to five decimal places.) What is the standard deviation of U.S. Treasury bills for 1980 to 1989? The standard deviation of U.S. Treasury bills for 1980 to 1989 is %. (Round to three decimal places.) What is the variance of long-term government bonds for 1980 to 1989? The variance of long-term government bonds for 1980 to 1989 is %. (Round to five decimal places.) What is the standard deviation of long-term government bonds for 1980 to 1989? The standard deviation of long-term government bonds for 1980 to 1989 is %. (Round to three decimal places.) Calculate the variance of small-company stocks for 1980 to 1989? The variance of small-company stocks for 1980 to 1989 is %. (Round to five decimal places.) Calculate the standard deviation of small-company stocks for 1980 to 1989? The standard deviation of small-company stocks for 1980 to 1989 is (Round to three decimal places.) 1966 1967 1968 1969 1970 1971 1972 1973 1974 1975 1976 1977 1978 1979 1980 1981 1982 1983 1984 1985 1986 1987 1988 1989 1990 1991 1992 1993 1994 1995 1996 1997 1998 1999 50-year average Standard Deviation 4.77% 4.24% 5.24% 6.59% 6.50% 4.34% 3.81% 6.91% 7.93% 5.80% 5.06% 5.10% 7.15% 10.45% 11.57% 14.95% 10.71% 8.85% 10.02% 7.83% 6.18% 5.50% 6.44% 8.32% 7.86% 5.65% 3.54% 2.97% 3.91% 5.58% 5.50% 5.32% 5.11% 4.80% 5.226% 3.70% -7.41% -1.20% -6.52% 12.69% 17.47% 5.55% 1.40% 5.53% 8.50% 11.07% 0.90% -4.16% 9.02% 13.17% 3.61% 6.52% -0.53% 15.29% 32.68% 23.96% -2.65% 8.40% 19.49% 7.13% 18.39% 7.79% 15.48% -7.18% 31.67% -0.81% 15.08% 13.52% -8.74% 5.936% -10.25% 24.11% 11.00% -8.33% 4.10% 14.17% 19.14% -14.75% -26.40% 37.26% 23.98% -7.26% 6.50% 18.77% 32.48% 4.98% 22.09% 22.37% 6.46% 32.00% 18.40% 5.34% 16.86% 31.34% -3.20% 30.66% 7.71% 9.87% 1.29% 37.71% 23.07% 33.17% 28.58% 21.04% 14.890% -8.08% 103.39% 50.61% -32.27% -16.54% 18.44% -0.62% 40.54% -29.74% 69.54% 54.81% 22.02% 22.29% 43.99% 35.34% 7.79% 27.44% 34.49% -14.02% 28.21% 3.40% -13.95% 21.72% 8.37% -27.08% 50.24% 27.84% 20.30% -3.34% 33.21% 16.50% 22.36% -2.55% 21.26% 17.103% 2.980% 9.493% 16.695% 29.043% Table 8.1 Year-by-Year Returns, 1950-1999 Three-Month U.S.Treasury Bills Large Company Small Company Stocks Stocks Year 1950 1951 1952 1953 1954 1955 1956 1957 1958 1959 1960 1961 1962 1963 1964 1965 1966 1967 1968 1969 1970 1971 1972 1973 1974 1975 1976 1977 1978 1979 1980 1981 1982 1983 1984 1.20% 1.49% 1.66% 1.82% 0.86% 1.57% 2.46% 3.14% 1.54% 2.95% 2.66% 2.13% 2.72% 3.12% 3.54% 3.94% 4.77% 4.24% 5.24% 6.59% 6.50% 4.34% 3.81% 6.91% 7.93% 5.80% 5.06% 5.10% 7.15% 10.45% 11.57% 14.95% 10.71% 8.85% 10.02% Long-Term Government Bonds -0.96% -1.95% 1.93% 3.83% 4.88% -1.34% -5.12% 9.46% -3.71% -3.55% 13.78% 0.19% 6.81% -0.49% 4.51% -0.27% 3.70% -7.41% -1.20% -6.52% 12.69% 17.47% 5.55% 1.40% 5.53% 8.50% 11.07% 0.90% -4.16% 9.02% 13.17% 3.61% 6.52% -0.53% 15.29% 32.68% 23.47% 18.91% -1.74% 52.55% 31.44% 6.45% -11.14% 43.78% 12.95% 0.19% 27.63% -8.79% 22.63% 16.67% 12.50% -10.25% 24.11% 11.00% -8.33% 4.10% 14.17% 19.14% -14.75% -26.40% 37.26% 23.98% -7.26% 6.50% 18.77% 32.48% 4.98% 22.09% 22.37% 6.46% 48.45% 9.41% 6.36% -5.66% 65.13% 21.84% 3.82% -15.03% 70.63% 17.82% -5.16% 30.48% -16.41% 12.20% 18.75% 37.67% -8.08% 103.39% 50.61% -32.27% -16.54% 18.44% -0.62% -40.54% -29.74% 69.54% 54.81% 22.02% 22.29% 43.99% 35.34% 7.79% 27.44% 34.49% -14.02% Variance and standard deviation. Calculate the variance and the standard deviation of U.S. Treasury bills, long-term government bonds, and small-company stocks for 1950 to 1959, 1960 to 1969, 1970 to 1979, and 1980 to 1989 from Table 8.1. Which had the highest variance? Which had the lowest variance? Click on the Spreadsheet Learning Aid to see Table 8.1Year-by-Year Returns, 1950-1999. Hint: Make sure to round all intermediate calculations to at least seven (7) decimal places. The input instructions, phrases in parenthesis after each answer box, only apply for the answers you will type. What is the variance of U.S. Treasury bills for 1980 to 1989? The variance of U.S. Treasury bills for 1980 to 1989 is (%. (Round to five decimal places.) What is the standard deviation of U.S. Treasury bills for 1980 to 1989? The standard deviation of U.S. Treasury bills for 1980 to 1989 is %. (Round to three decimal places.) What is the variance of long-term government bonds for 1980 to 1989? The variance of long-term government bonds for 1980 to 1989 is %. (Round to five decimal places.) What is the standard deviation of long-term government bonds for 1980 to 1989? The standard deviation of long-term government bonds for 1980 to 1989 is %. (Round to three decimal places.) Calculate the variance of small-company stocks for 1980 to 1989? The variance of small-company stocks for 1980 to 1989 is %. (Round to five decimal places.) Calculate the standard deviation of small-company stocks for 1980 to 1989? The standard deviation of small-company stocks for 1980 to 1989 is (Round to three decimal places.) 1966 1967 1968 1969 1970 1971 1972 1973 1974 1975 1976 1977 1978 1979 1980 1981 1982 1983 1984 1985 1986 1987 1988 1989 1990 1991 1992 1993 1994 1995 1996 1997 1998 1999 50-year average Standard Deviation 4.77% 4.24% 5.24% 6.59% 6.50% 4.34% 3.81% 6.91% 7.93% 5.80% 5.06% 5.10% 7.15% 10.45% 11.57% 14.95% 10.71% 8.85% 10.02% 7.83% 6.18% 5.50% 6.44% 8.32% 7.86% 5.65% 3.54% 2.97% 3.91% 5.58% 5.50% 5.32% 5.11% 4.80% 5.226% 3.70% -7.41% -1.20% -6.52% 12.69% 17.47% 5.55% 1.40% 5.53% 8.50% 11.07% 0.90% -4.16% 9.02% 13.17% 3.61% 6.52% -0.53% 15.29% 32.68% 23.96% -2.65% 8.40% 19.49% 7.13% 18.39% 7.79% 15.48% -7.18% 31.67% -0.81% 15.08% 13.52% -8.74% 5.936% -10.25% 24.11% 11.00% -8.33% 4.10% 14.17% 19.14% -14.75% -26.40% 37.26% 23.98% -7.26% 6.50% 18.77% 32.48% 4.98% 22.09% 22.37% 6.46% 32.00% 18.40% 5.34% 16.86% 31.34% -3.20% 30.66% 7.71% 9.87% 1.29% 37.71% 23.07% 33.17% 28.58% 21.04% 14.890% -8.08% 103.39% 50.61% -32.27% -16.54% 18.44% -0.62% 40.54% -29.74% 69.54% 54.81% 22.02% 22.29% 43.99% 35.34% 7.79% 27.44% 34.49% -14.02% 28.21% 3.40% -13.95% 21.72% 8.37% -27.08% 50.24% 27.84% 20.30% -3.34% 33.21% 16.50% 22.36% -2.55% 21.26% 17.103% 2.980% 9.493% 16.695% 29.043% Table 8.1 Year-by-Year Returns, 1950-1999 Three-Month U.S.Treasury Bills Large Company Small Company Stocks Stocks Year 1950 1951 1952 1953 1954 1955 1956 1957 1958 1959 1960 1961 1962 1963 1964 1965 1966 1967 1968 1969 1970 1971 1972 1973 1974 1975 1976 1977 1978 1979 1980 1981 1982 1983 1984 1.20% 1.49% 1.66% 1.82% 0.86% 1.57% 2.46% 3.14% 1.54% 2.95% 2.66% 2.13% 2.72% 3.12% 3.54% 3.94% 4.77% 4.24% 5.24% 6.59% 6.50% 4.34% 3.81% 6.91% 7.93% 5.80% 5.06% 5.10% 7.15% 10.45% 11.57% 14.95% 10.71% 8.85% 10.02% Long-Term Government Bonds -0.96% -1.95% 1.93% 3.83% 4.88% -1.34% -5.12% 9.46% -3.71% -3.55% 13.78% 0.19% 6.81% -0.49% 4.51% -0.27% 3.70% -7.41% -1.20% -6.52% 12.69% 17.47% 5.55% 1.40% 5.53% 8.50% 11.07% 0.90% -4.16% 9.02% 13.17% 3.61% 6.52% -0.53% 15.29% 32.68% 23.47% 18.91% -1.74% 52.55% 31.44% 6.45% -11.14% 43.78% 12.95% 0.19% 27.63% -8.79% 22.63% 16.67% 12.50% -10.25% 24.11% 11.00% -8.33% 4.10% 14.17% 19.14% -14.75% -26.40% 37.26% 23.98% -7.26% 6.50% 18.77% 32.48% 4.98% 22.09% 22.37% 6.46% 48.45% 9.41% 6.36% -5.66% 65.13% 21.84% 3.82% -15.03% 70.63% 17.82% -5.16% 30.48% -16.41% 12.20% 18.75% 37.67% -8.08% 103.39% 50.61% -32.27% -16.54% 18.44% -0.62% -40.54% -29.74% 69.54% 54.81% 22.02% 22.29% 43.99% 35.34% 7.79% 27.44% 34.49% -14.02%
Step by Step Solution
There are 3 Steps involved in it

Get step-by-step solutions from verified subject matter experts