

Question: Variance and standard deviation.Calculate the variance and the standard deviation of U.S. Treasury bills, long-term government bonds, and small-company stocks for 1950 to 1959, 1960
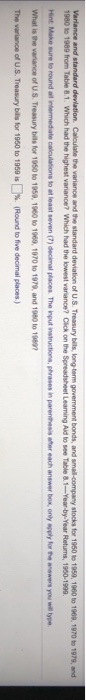 Variance and standard deviation.Calculate the variance and the standard deviation of U.S. Treasury bills, long-term government bonds, and small-company stocks for 1950 to 1959, 1960 to 1969, 1970 to 1979, and 1980 to 1989 from Table 8.1. Which had the highest variance? Which had the lowest variance? Click on the Spreadsheet Learning Aid to see Table 8.1
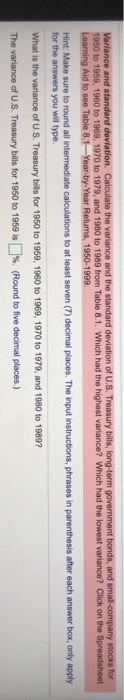
and the standard deviation of U.S. Treasury bills, long-term govemment bonds, and small-company stocks for 1950 to 1959, 1960 to 1969, 1970 to 1979, and 1980 t0 1989 from Table 8.1. Which had the highest variance? Which had the lowest variance? Click on the Spreadsheet Learning Aid to see Table &.1-Year-by-Year Returns, 1950-1999 Hint Mako sure to round an nemmedate celoulations to at loast seven (7) decimal places The nput nstructions, phrases parentess aher each answer box, only agply for wers you wil type U.S. Treasury bils for 1950 to 1 The variance of us. Treasury bils tor 1960 to 1989 is%. Round to five decimal places) ( ny stocks 950 to 1959, 1960 to 1969, 1970 to 1979, and 1980 to 1989 from Table 8.1. Which had the highest variance? Which had the lowest variance? Click on the Spreadsheet Hint Make sure to round all intermediate calculations to at least seven (7) decimal places. The input instructions, phrases in parenthesis after each answer box, only apply for the answers you will type. What is the variance of U.S. Treasury bills for 1950 to 1959, 1960 to 1969, 1970 to 1979, and 1980 to 1989 The variance of US Treasury bills for 1950 to 1959 is %. (Round to five decimal places.) and the standard deviation of U.S. Treasury bills, long-term govemment bonds, and small-company stocks for 1950 to 1959, 1960 to 1969, 1970 to 1979, and 1980 t0 1989 from Table 8.1. Which had the highest variance? Which had the lowest variance? Click on the Spreadsheet Learning Aid to see Table &.1-Year-by-Year Returns, 1950-1999 Hint Mako sure to round an nemmedate celoulations to at loast seven (7) decimal places The nput nstructions, phrases parentess aher each answer box, only agply for wers you wil type U.S. Treasury bils for 1950 to 1 The variance of us. Treasury bils tor 1960 to 1989 is%. Round to five decimal places) ( ny stocks 950 to 1959, 1960 to 1969, 1970 to 1979, and 1980 to 1989 from Table 8.1. Which had the highest variance? Which had the lowest variance? Click on the Spreadsheet Hint Make sure to round all intermediate calculations to at least seven (7) decimal places. The input instructions, phrases in parenthesis after each answer box, only apply for the answers you will type. What is the variance of U.S. Treasury bills for 1950 to 1959, 1960 to 1969, 1970 to 1979, and 1980 to 1989 The variance of US Treasury bills for 1950 to 1959 is %. (Round to five decimal places.)
Step by Step Solution
There are 3 Steps involved in it

Get step-by-step solutions from verified subject matter experts