

Question: Variance explained 100% 75% 50% 25% 0% Dimensions retained Not retained Write your answers below each question: c) What information is represented in the bar
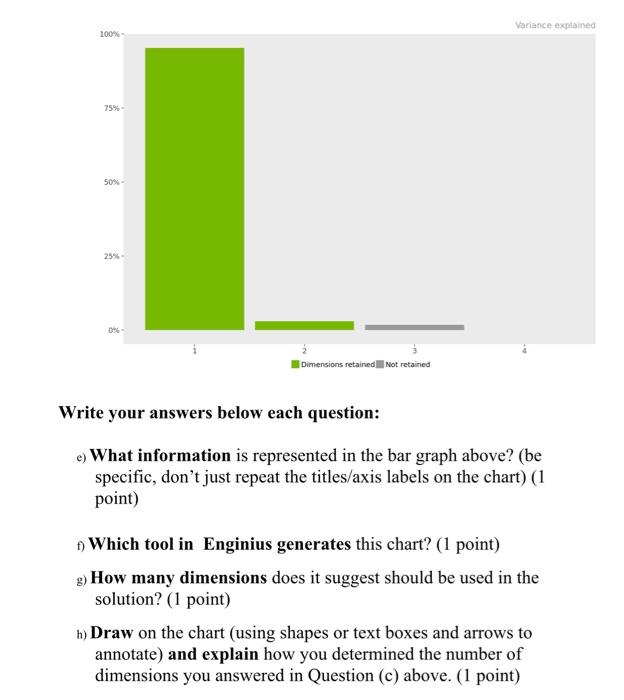
Variance explained 100% 75% 50% 25% 0% Dimensions retained Not retained Write your answers below each question: c) What information is represented in the bar graph above? (be specific, don't just repeat the titles/axis labels on the chart) (1 point) .) Which tool in Enginius generates this chart? (1 point) 8) How many dimensions does it suggest should be used in the solution? (1 point) h) Draw on the chart (using shapes or text boxes and arrows to annotate) and explain how you determined the number of dimensions you answered in Question (c) above. (1 point)
Step by Step Solution
There are 3 Steps involved in it
1 Expert Approved Answer
Step: 1 Unlock

Question Has Been Solved by an Expert!
Get step-by-step solutions from verified subject matter experts
Step: 2 Unlock
Step: 3 Unlock