

Question: Version:0.9 StartHTML:0000000105 EndHTML:0000001175 StartFragment:0000000141 EndFragment:0000001135 Identify all issues P/S: No need to describe in detail. Just identify the issues e.g. CS1: (a) peak tailing; (b)
Version:0.9 StartHTML:0000000105 EndHTML:0000001175 StartFragment:0000000141 EndFragment:0000001135
Identify all issues
P/S: No need to describe in detail. Just identify the issues
e.g. CS1: (a) peak tailing; (b) ghosting
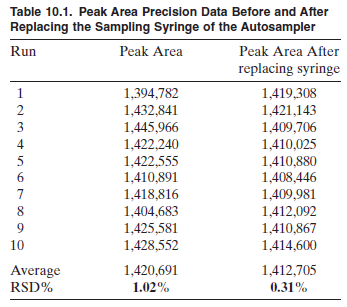
Table 10.1. Peak Area Precision Data Before and After Replacing the Sampling Syringe of the Autosampler Run Peak Area Peak Area After replacing syringe 1 1,394,782 1,419,308 2 1,432,841 1,421,143 3 1,445,966 1,409,706 4 1,422.240 1,410,025 5 1,422,555 1,410,880 6 1,410,891 1,408,446 7 1,418,816 1,409,981 8 1,404,683 1,412,092 9 1,425,581 1,410,867 10 1,428,552 1,414,600 Average 1,420,691 1,412,705 RSD% 1.02% 0.31%
Step by Step Solution
There are 3 Steps involved in it

Get step-by-step solutions from verified subject matter experts