

Question: vertical analysis analysis of each financial statement items as a percentage of a base item ( total assets,total revenue ) for Apple inc & microsoft
vertical analysis
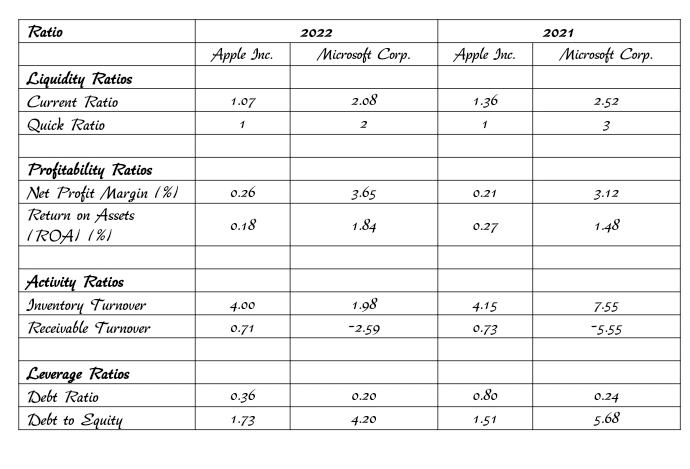
analysis of each financial statement items as a percentage of a base item total assets,total revenue for Apple inc & microsoft corporation with using below ration table?
tableRatioApple Inc.,Microsoft Corp.,Apple Inc.,Microsoft Corp.Liquidity RatiosCurrent Ratio,Quick Ratio,Profitability RatiosNet Profit Margin tableReturn on AssetsROAActivity RatiosInventory Turnover,Receivable Turnover,Leverage RatiosDebt Ratio,Debt to Equity,
Step by Step Solution
There are 3 Steps involved in it
1 Expert Approved Answer
Step: 1 Unlock

Question Has Been Solved by an Expert!
Get step-by-step solutions from verified subject matter experts
Step: 2 Unlock
Step: 3 Unlock