

Question: vertical analysis Vertical analysis The following data are taken from recent financial statements of Nike, Inc. (in millions): Year 2 Year 1 Sales (revenues) $36,397
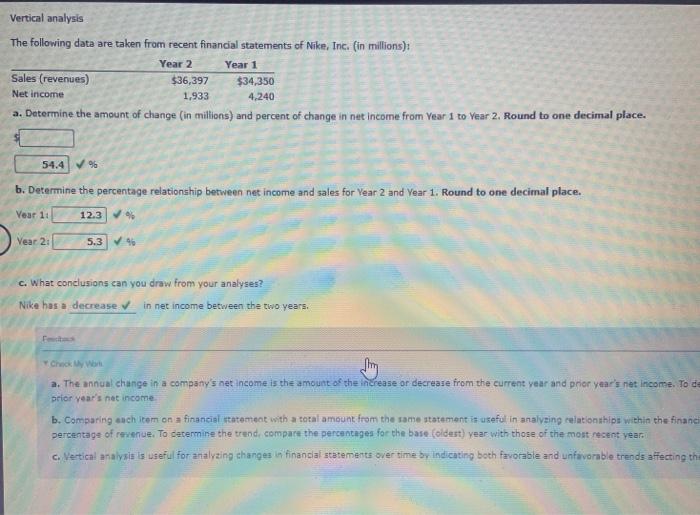
Vertical analysis The following data are taken from recent financial statements of Nike, Inc. (in millions): Year 2 Year 1 Sales (revenues) $36,397 $34,350 1.933 4,240 a. Determine the amount of change (in millions) and percent of change in net income from Year 1 to Year 2. Round to one decimal place. Net income 54.4 % b. Determine the percentage relationship between net income and sales for Year 2 and Year 1. Round to one decimal place. 12.34 Voar 11 Vear 2: 5.3 % c. What conclusions can you draw from your analyses? Nike has a decrease in net income between the two years. Chook My World a. The annual change in a company's net income is the amount of the increase or decrease from the current year and prior year's net income. To de prior year's net income b. Comparing each item on a financial statement with a total amount from the same statement is useful in analyzing relationships within the financi percentage of revenue. To determine the trend compare the percentages for the base foldest) year with those of the most recent year C. Vertical analysis is useful for analyzing changes in financial statements over time by indicating both favorable and unfavorable trends affecting th
Step by Step Solution
There are 3 Steps involved in it

Get step-by-step solutions from verified subject matter experts