

Question: very urgent Question 2 5 points Save Answer A random survey of 233 drivers measured each drivers anger score. Higher scores indicated higher propensities for
very urgent
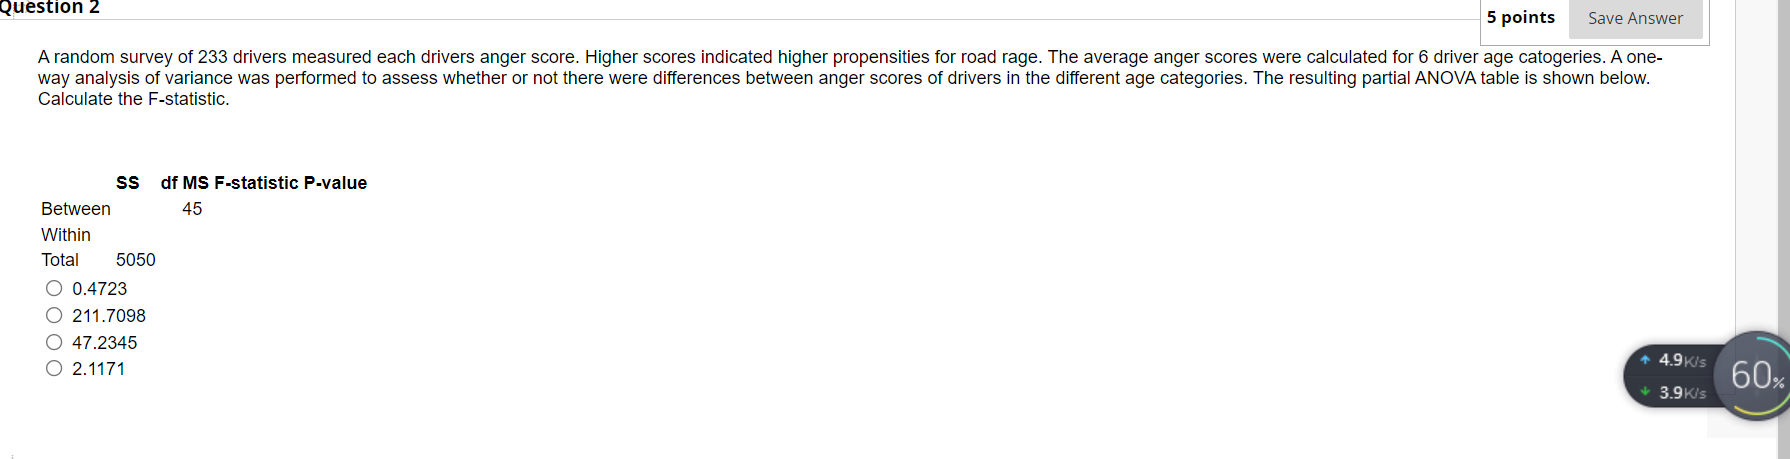

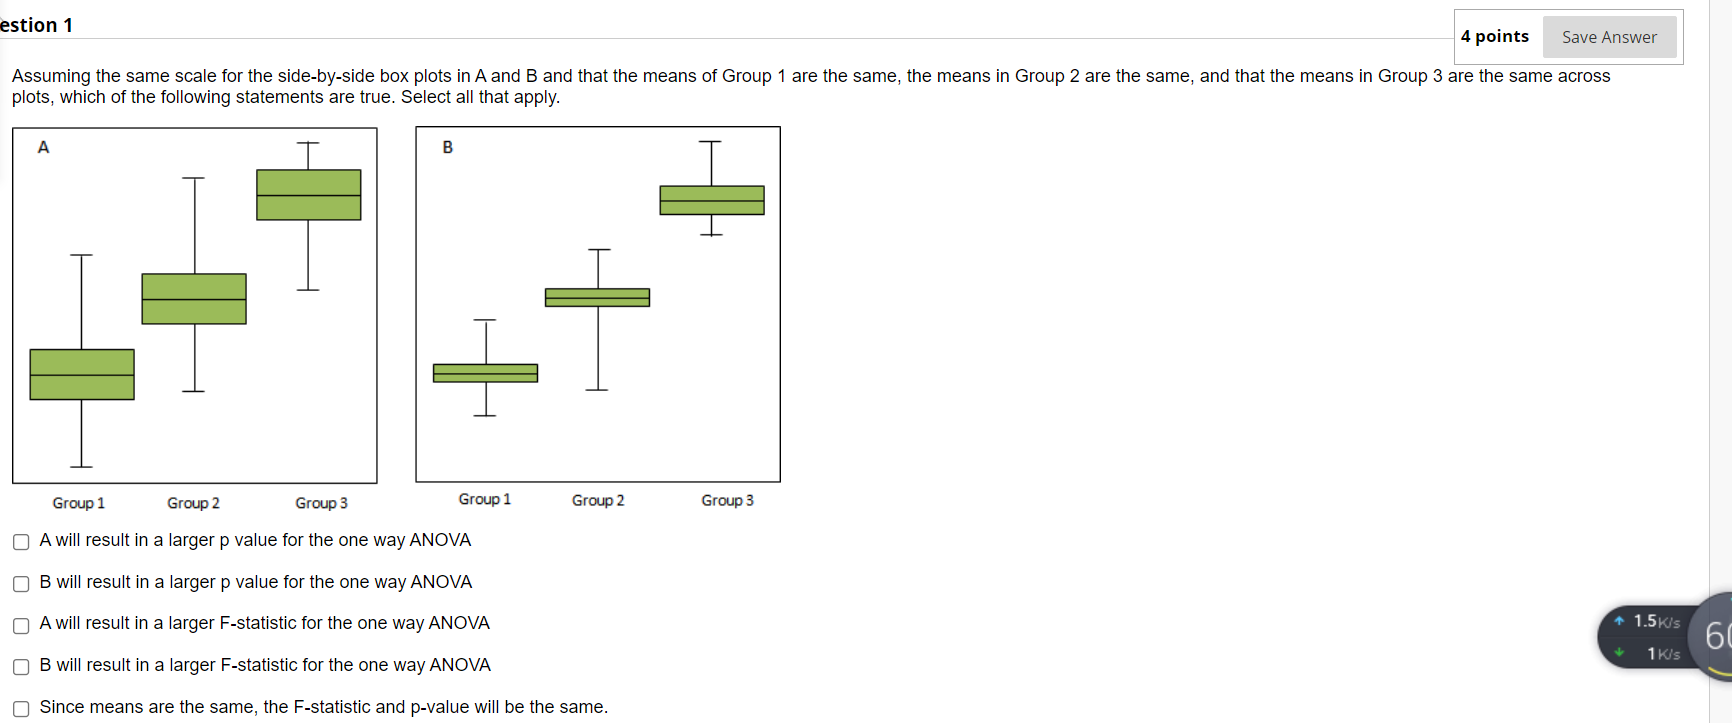
Question 2 5 points Save Answer A random survey of 233 drivers measured each drivers anger score. Higher scores indicated higher propensities for road rage. The average anger scores were calculated for 6 driver age catogeries. A one- way analysis of variance was performed to assess whether or not there were differences between anger scores of drivers in the different age categories. The resulting partial ANOVA table is shown below. Calculate the F-statistic. SS df MS F-statistic P-value Between 45 Within Total 5050 O 0.4723 O 211.7098 O 47.2345 + 4.9Kis O 2.1171 60% 3.9K/siastion 1 4 points Save Answer Assuming the same scale for the sidebyeide box plots in A and B and that the means of Group 1 are the same, the means in Group 2 are the same, and that the means in Group 3 are the same across plots, which of the following statements are true. Select all that apply. A B Group 1 Gran 2 Group 5 GI'WP 1 GRID 2 Group 3 [:1 A will result in a larger p value for the one way ANOVA [:1 B will result in a larger p value for the one way ANOVA [:1 A will result in a larger F-slatistic for the one way ANOVA [:1 B will result in a larger F-statistic for the one way ANOVA [:1 Since means are the same, the F-statistic and p-value will be the same
Step by Step Solution
There are 3 Steps involved in it

Get step-by-step solutions from verified subject matter experts