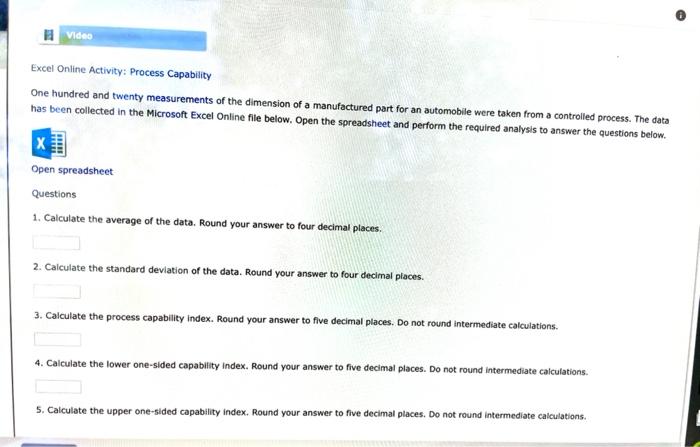
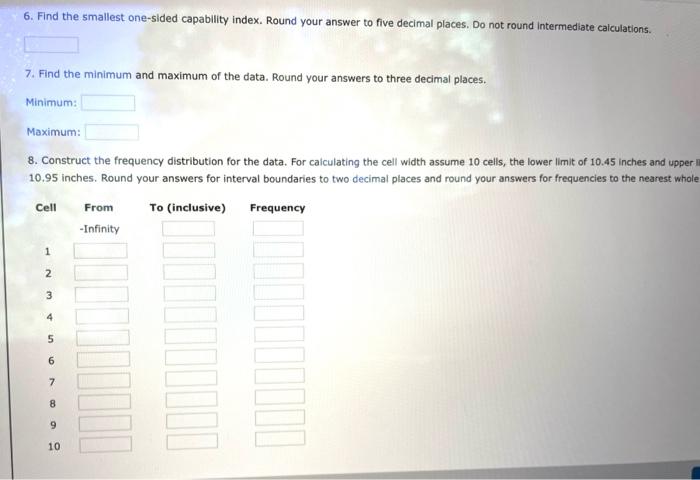
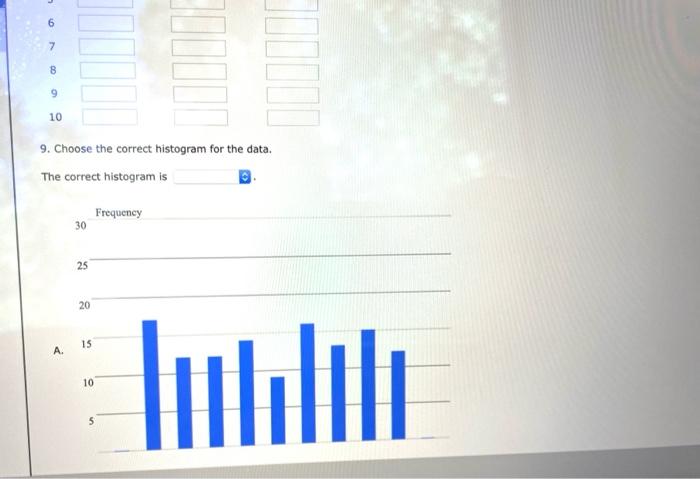
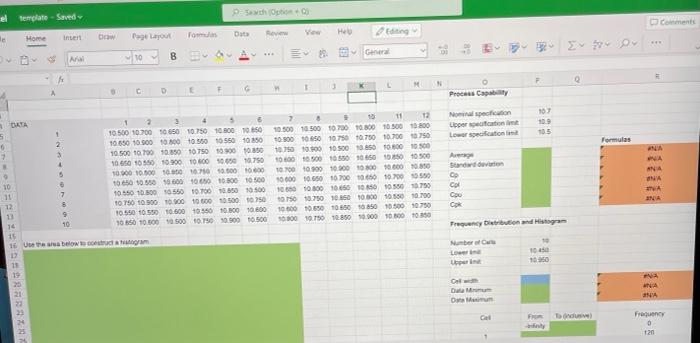
Question: Video Excel Online Activity: Process Capability One hundred and twenty measurements of the dimension of a manufactured part for an automobile were taken from a

Video Excel Online Activity: Process Capability
Video Excel Online Activity: Process Capability One hundred and twenty measurements of the dimension of a manufactured part for an automobile were taken from a controlled process. The data has been collected in the Microsoft Excel Online file below. Open the spreadsheet and perform the required analysis to answer the questions below. Open spreadsheet Questions 1. Calculate the average of the data. Round your answer to four decimal places. 2. Calculate the standard deviation of the data. Round your answer to four decimal places. 3. Calculate the process capability index. Round your answer to five decimal places. Do not round intermediate calculations. 4. Calculate the lower one-sided capability Index. Round your answer to five decimal places. Do not round Intermediate calculations 5. Calculate the upper one-sided capability Index. Round your answer to five decimal places. Do not round Intermediate calculations 6. Find the smallest one-sided capability index. Round your answer to five decimal places. Do not round Intermediate calculations. 7. Find the minimum and maximum of the data. Round your answers to three decimal places. Minimum: Maximum: 8. Construct the frequency distribution for the data. For calculating the cell width assume 10 cells, the lower limit of 10.45 inches and upper 10.95 inches. Round your answers for interval boundaries to two decimal places and round your answers for frequencies to the nearest whole To (inclusive) Frequency - Infinity Cell From 1 2 3 4 5 6 7 8 9 10 6 7 8 9 10 9. Choose the correct histogram for the data. The correct histogram is Frequency 30 25 20 IS A. 10 luulili 5 Seth Option el template - Saved Comments HU Editing Home Intent F w Layout ++ Evo A VO B - Q M N E 1 3 C D + G A O Process Capability 107 No specification Loreto Lower Section 35 5 . Formulas 1 2 3 10.500 10.700 50 60 10.750 10.500 10.650 10650 10 500 1000 10:5501655090850 10 500 1000 1050 10750 900 10.50 1050 10550 10.00 10.000 50.650 1.750 10000 10000 10000 100.000000 10 6 10 350 1000 1000 100 1000 10.560 10.00 10550 1000 16.50 10.500 TO 760 10.500 1000 10000 15000 750 10.560 10550 10.60010566 10 800 1.800 1066 10000 1000 10.750 0.000000 12 10.500 16.500 10 730 10.00 10.500 1800 10 500 1050 10.750 0.750 10.100750 10750 19.500 1000 1550 10.00 10.500 1000 16.500 1050 1050050 10500 10000 9000 90000 90000 90.850 1000010650 10700 10650 10.790550 1060 10.800 1050 1050 10550 5750 0750 10.750 1050 10500 1050 10.700 10600 10.650 10650 1650 10500 10.750 50.000 19.750 1050 10000 10000 100 A Sandard G Col Cou ANA NA ANA NA 10 11 INA Fry Distribution and Histogram 21 14 10 15 16 Utre below Number 10450 100 Chl 11 19 25 21 22 23 NA ANA ANA Call To Frequency 0 120 23 Video Excel Online Activity: Process Capability One hundred and twenty measurements of the dimension of a manufactured part for an automobile were taken from a controlled process. The data has been collected in the Microsoft Excel Online file below. Open the spreadsheet and perform the required analysis to answer the questions below. Open spreadsheet Questions 1. Calculate the average of the data. Round your answer to four decimal places. 2. Calculate the standard deviation of the data. Round your answer to four decimal places. 3. Calculate the process capability index. Round your answer to five decimal places. Do not round intermediate calculations. 4. Calculate the lower one-sided capability Index. Round your answer to five decimal places. Do not round Intermediate calculations 5. Calculate the upper one-sided capability Index. Round your answer to five decimal places. Do not round Intermediate calculations 6. Find the smallest one-sided capability index. Round your answer to five decimal places. Do not round Intermediate calculations. 7. Find the minimum and maximum of the data. Round your answers to three decimal places. Minimum: Maximum: 8. Construct the frequency distribution for the data. For calculating the cell width assume 10 cells, the lower limit of 10.45 inches and upper 10.95 inches. Round your answers for interval boundaries to two decimal places and round your answers for frequencies to the nearest whole To (inclusive) Frequency - Infinity Cell From 1 2 3 4 5 6 7 8 9 10 6 7 8 9 10 9. Choose the correct histogram for the data. The correct histogram is Frequency 30 25 20 IS A. 10 luulili 5 Seth Option el template - Saved Comments HU Editing Home Intent F w Layout ++ Evo A VO B - Q M N E 1 3 C D + G A O Process Capability 107 No specification Loreto Lower Section 35 5 . Formulas 1 2 3 10.500 10.700 50 60 10.750 10.500 10.650 10650 10 500 1000 10:5501655090850 10 500 1000 1050 10750 900 10.50 1050 10550 10.00 10.000 50.650 1.750 10000 10000 10000 100.000000 10 6 10 350 1000 1000 100 1000 10.560 10.00 10550 1000 16.50 10.500 TO 760 10.500 1000 10000 15000 750 10.560 10550 10.60010566 10 800 1.800 1066 10000 1000 10.750 0.000000 12 10.500 16.500 10 730 10.00 10.500 1800 10 500 1050 10.750 0.750 10.100750 10750 19.500 1000 1550 10.00 10.500 1000 16.500 1050 1050050 10500 10000 9000 90000 90000 90.850 1000010650 10700 10650 10.790550 1060 10.800 1050 1050 10550 5750 0750 10.750 1050 10500 1050 10.700 10600 10.650 10650 1650 10500 10.750 50.000 19.750 1050 10000 10000 100 A Sandard G Col Cou ANA NA ANA NA 10 11 INA Fry Distribution and Histogram 21 14 10 15 16 Utre below Number 10450 100 Chl 11 19 25 21 22 23 NA ANA ANA Call To Frequency 0 120 23

Step by Step Solution

There are 3 Steps involved in it

1 Expert Approved Answer
Step: 1 Unlock blur-text-image
Question Has Been Solved by an Expert!

Get step-by-step solutions from verified subject matter experts

Step: 2 Unlock
Step: 3 Unlock

Students Have Also Explored These Related General Management Questions!