

Question: View 124% + T Zoom + Simple Data Add Category Weighted Data Insert Table Chart Text Shape Media Comment Collaborate Format Organize Intervalled Data
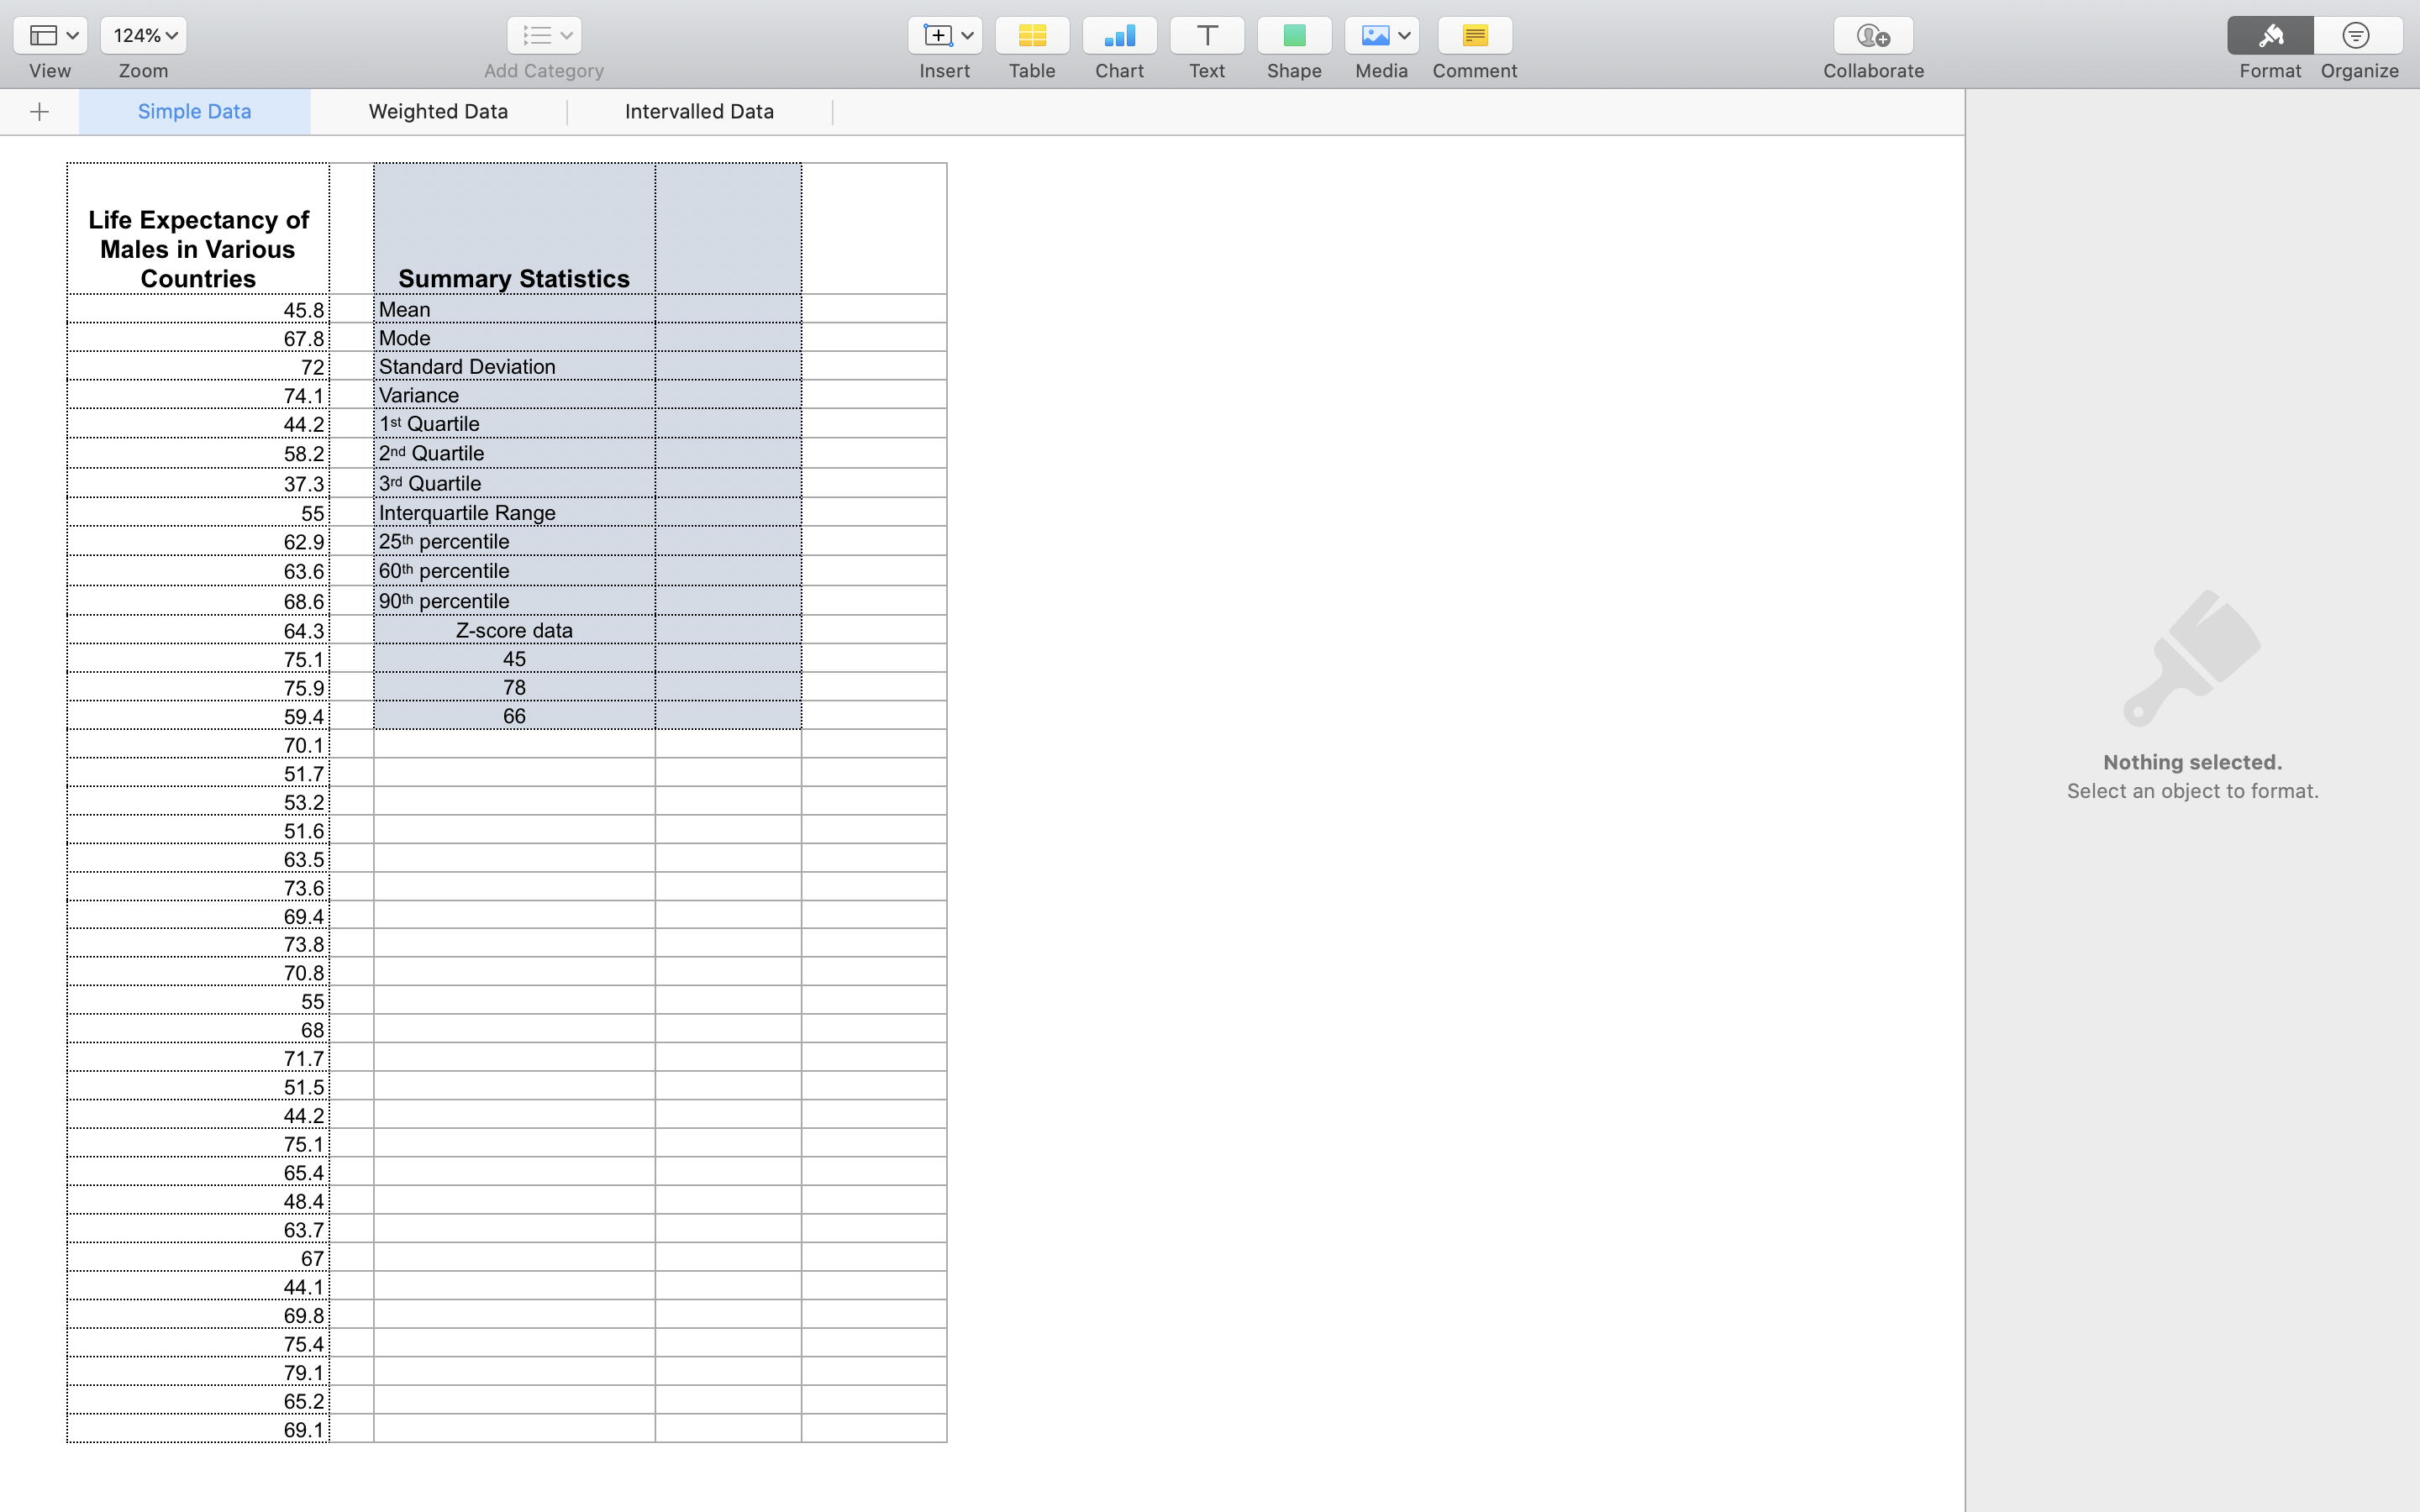
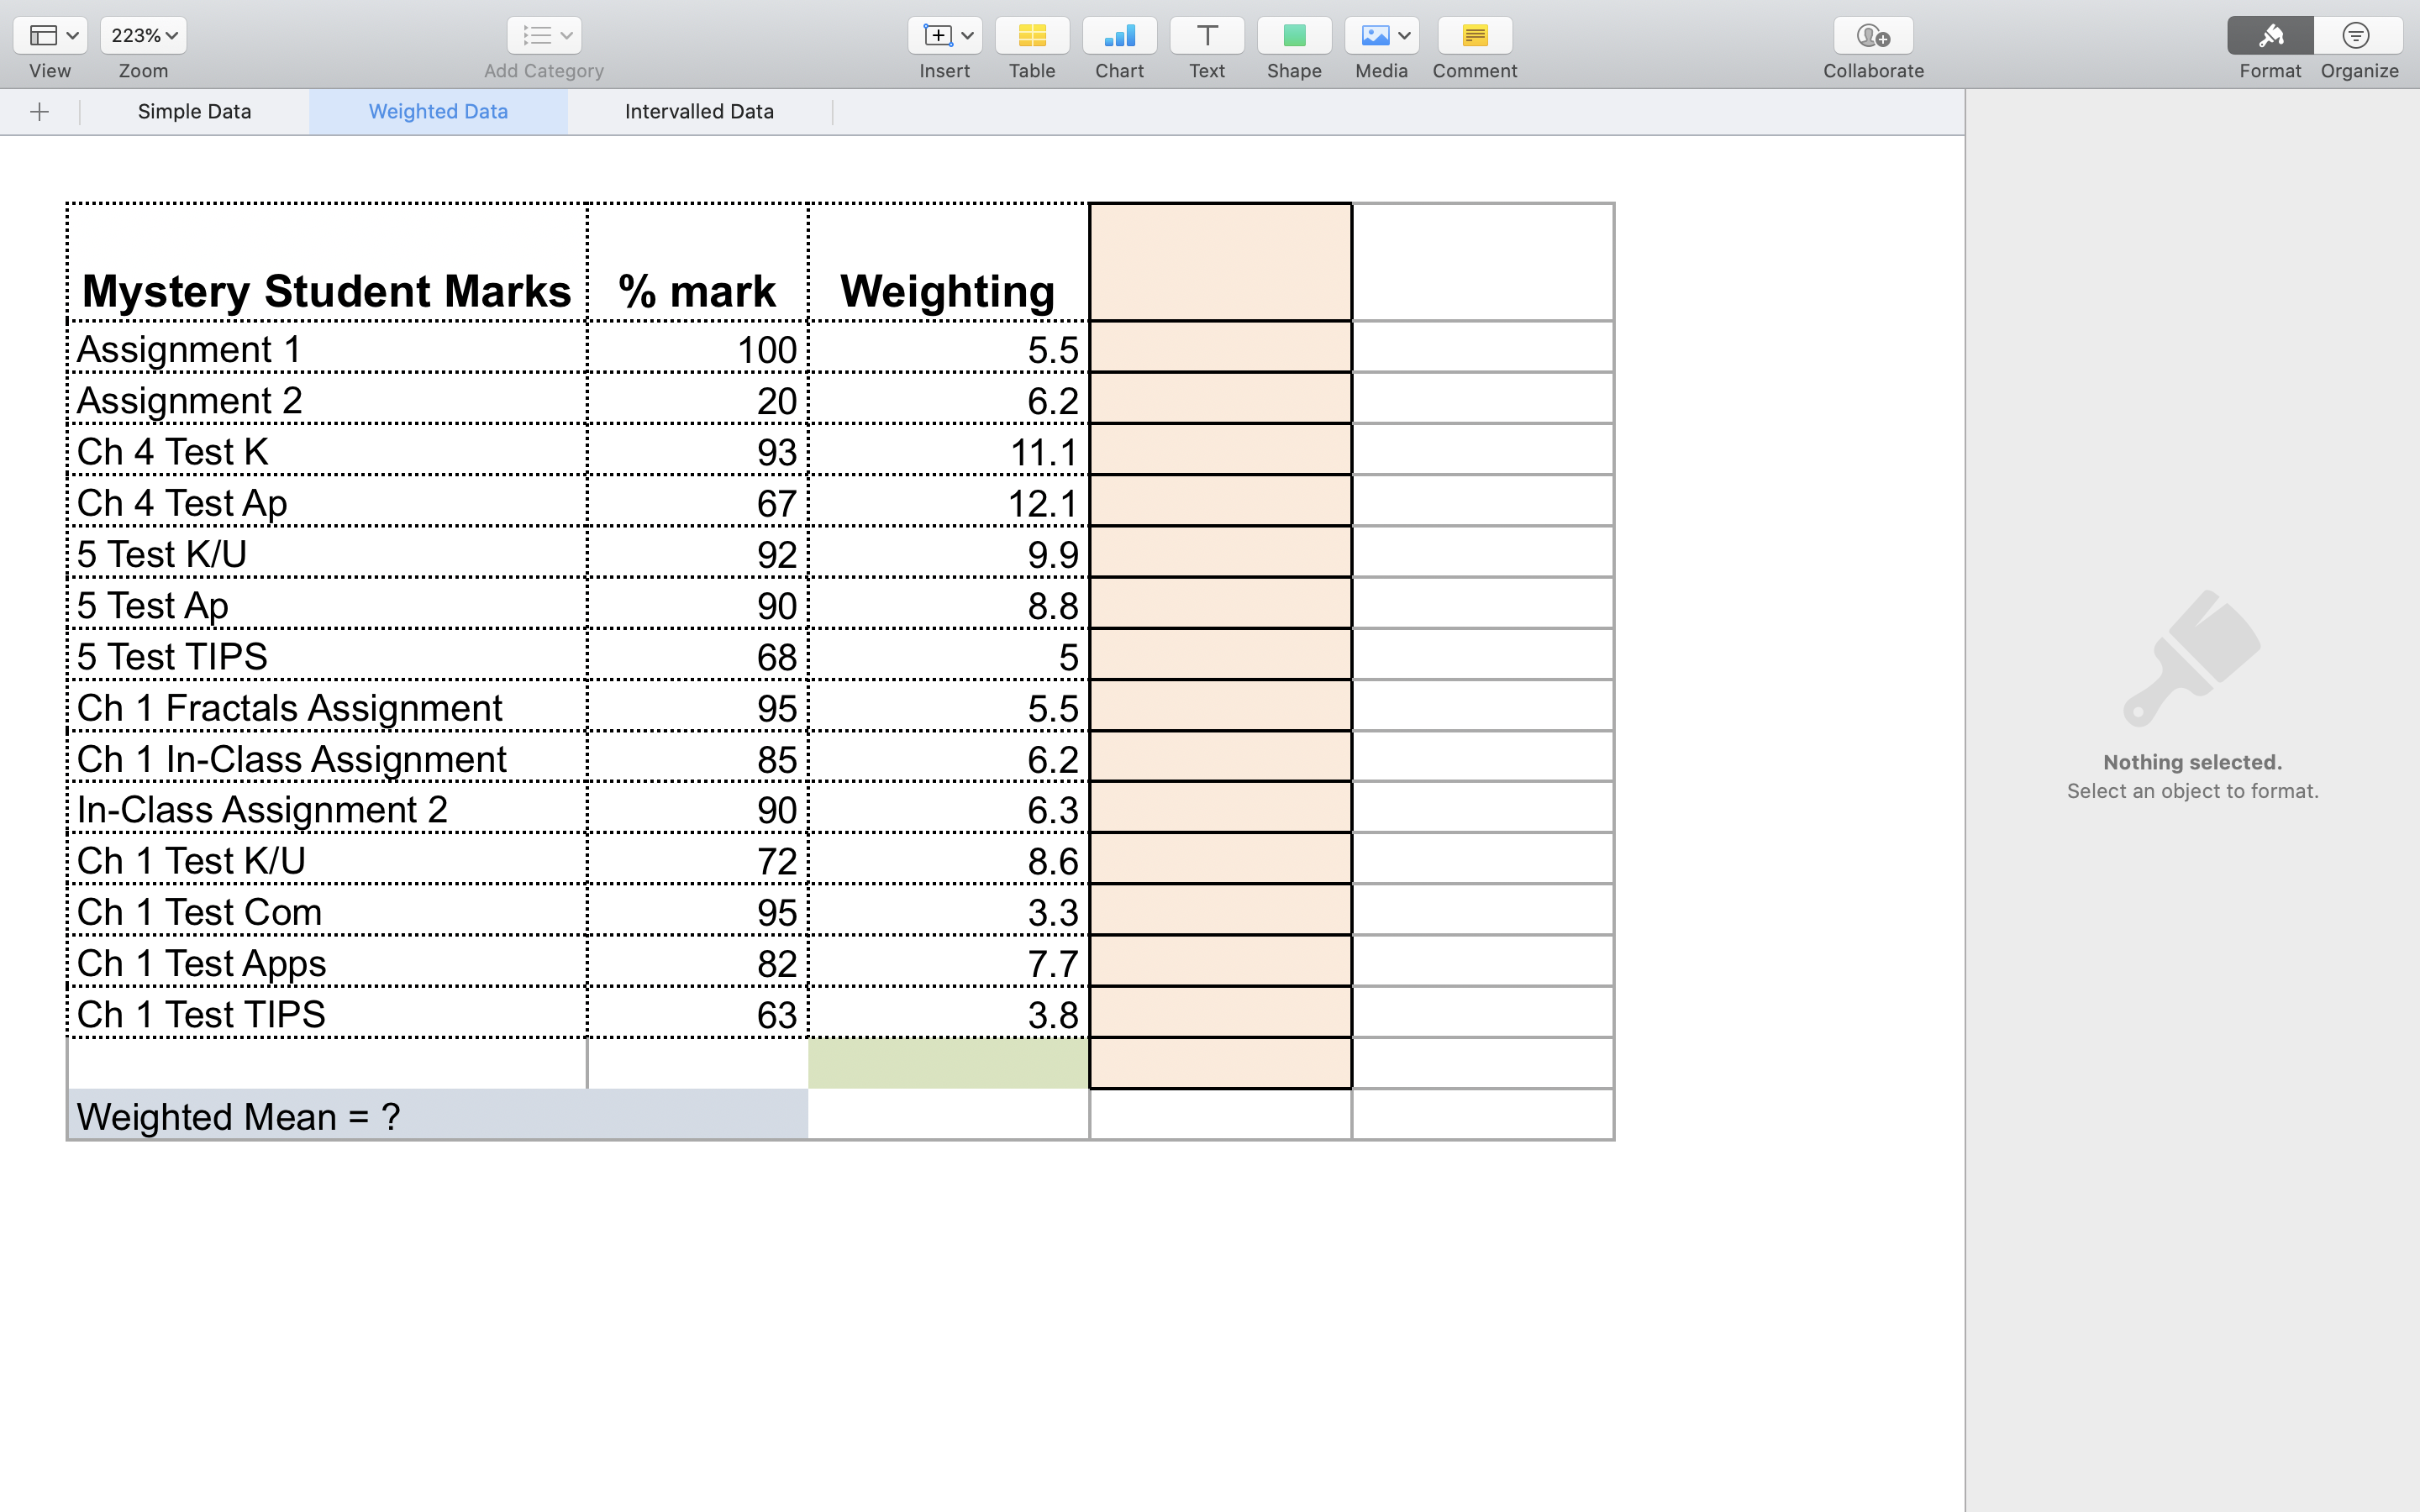
View 124% + T Zoom + Simple Data Add Category Weighted Data Insert Table Chart Text Shape Media Comment Collaborate Format Organize Intervalled Data Life Expectancy of Males in Various Countries Summary Statistics 45.8 Mean 67.8 Mode 72 Standard Deviation 74.1 Variance 44.2 1st Quartile 58.2 2nd Quartile 37.3 3rd Quartile 55 Interquartile Range 62.9 25th percentile 63.6 60th percentile 68.6 90th percentile 64.3 Z-score data 75.1 45 75.9 78 59.4 66 70.1 51.7 53.2 51.6 63.5 73.6 69.4 73.8 70.8 55 68 71.7 51.5 44.2 75.1 65.4 48.4 63.7 67 44.1 69.8 75.4 79.1 65.2 69.1 Nothing selected. Select an object to format. View + 223% + T Zoom Simple Data Add Category Weighted Data Insert Table Chart Text Shape Media Comment Collaborate Format Organize Intervalled Data Mystery Student Marks % mark Weighting Assignment 1 Assignment 2 Ch 4 Test K Ch 4 Test Ap 5 Test K/U 5 Test Ap 5 Test TIPS Ch 1 Fractals Assignment Ch 1 In-Class Assignment 95 85 In-Class Assignment 2 90 Ch 1 Test K/U 72 Ch 1 Test Com 95 Ch 1 Test Apps Ch 1 Test TIPS 63 100 22262262222228 5.5 20 6.2 93 11.1 67 12.1 92 9.9 90 8.8 LO 5 5.5 6.2 6.3 8.6 3.3 7.7 3.8 Weighted Mean = ? Nothing selected. Select an object to format.
Step by Step Solution
There are 3 Steps involved in it

Get step-by-step solutions from verified subject matter experts