

Question: View 187% v Zoom + T Add Category Insert Table Chart Text Shape Media Comment Collaborate Format Organize Simple Data Weighted Data Intervalled Data
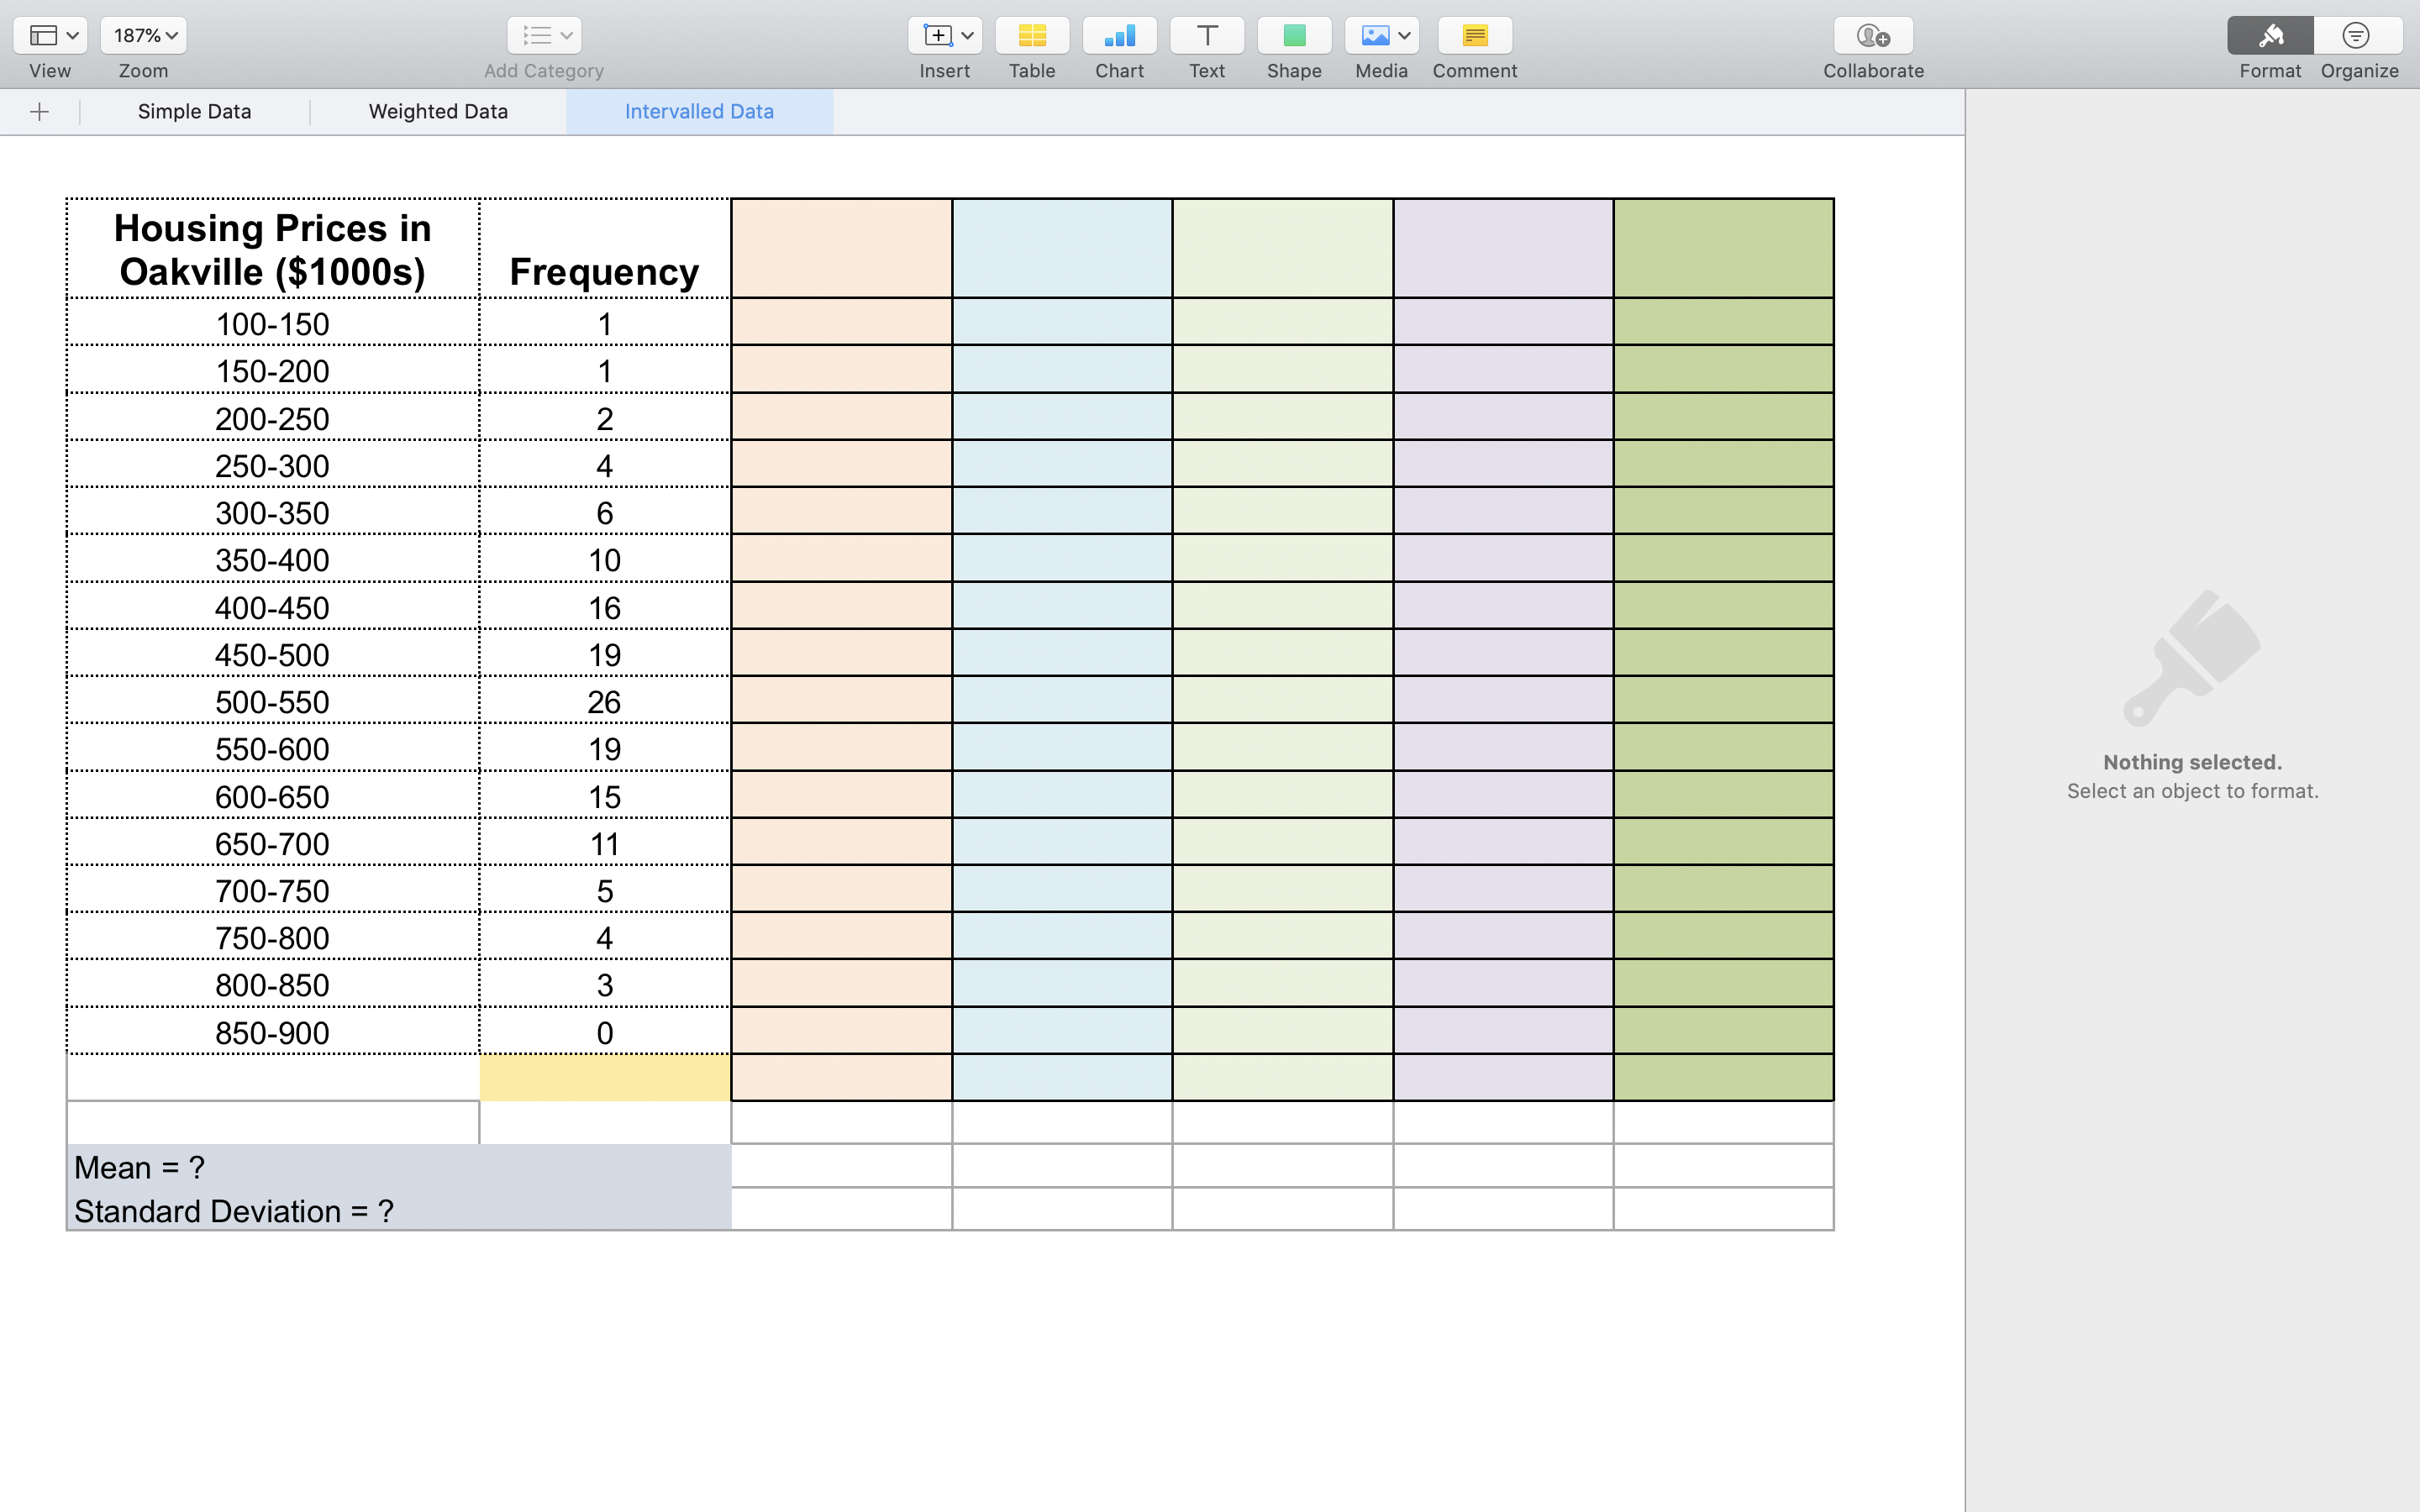
View 187% v Zoom + T Add Category Insert Table Chart Text Shape Media Comment Collaborate Format Organize Simple Data Weighted Data Intervalled Data Housing Prices in Oakville ($1000s) Frequency 100-150 1 150-200 1 200-250 2 250-300 4 300-350 6 350-400 10 400-450 16 450-500 19 500-550 26 550-600 19 600-650 15 650-700 11 700-750 5 750-800 4 800-850 3 850-900 0 Mean = ? Standard Deviation = ? Nothing selected. Select an object to format.
Step by Step Solution
There are 3 Steps involved in it
1 Expert Approved Answer
Step: 1 Unlock

Question Has Been Solved by an Expert!
Get step-by-step solutions from verified subject matter experts
Step: 2 Unlock
Step: 3 Unlock