

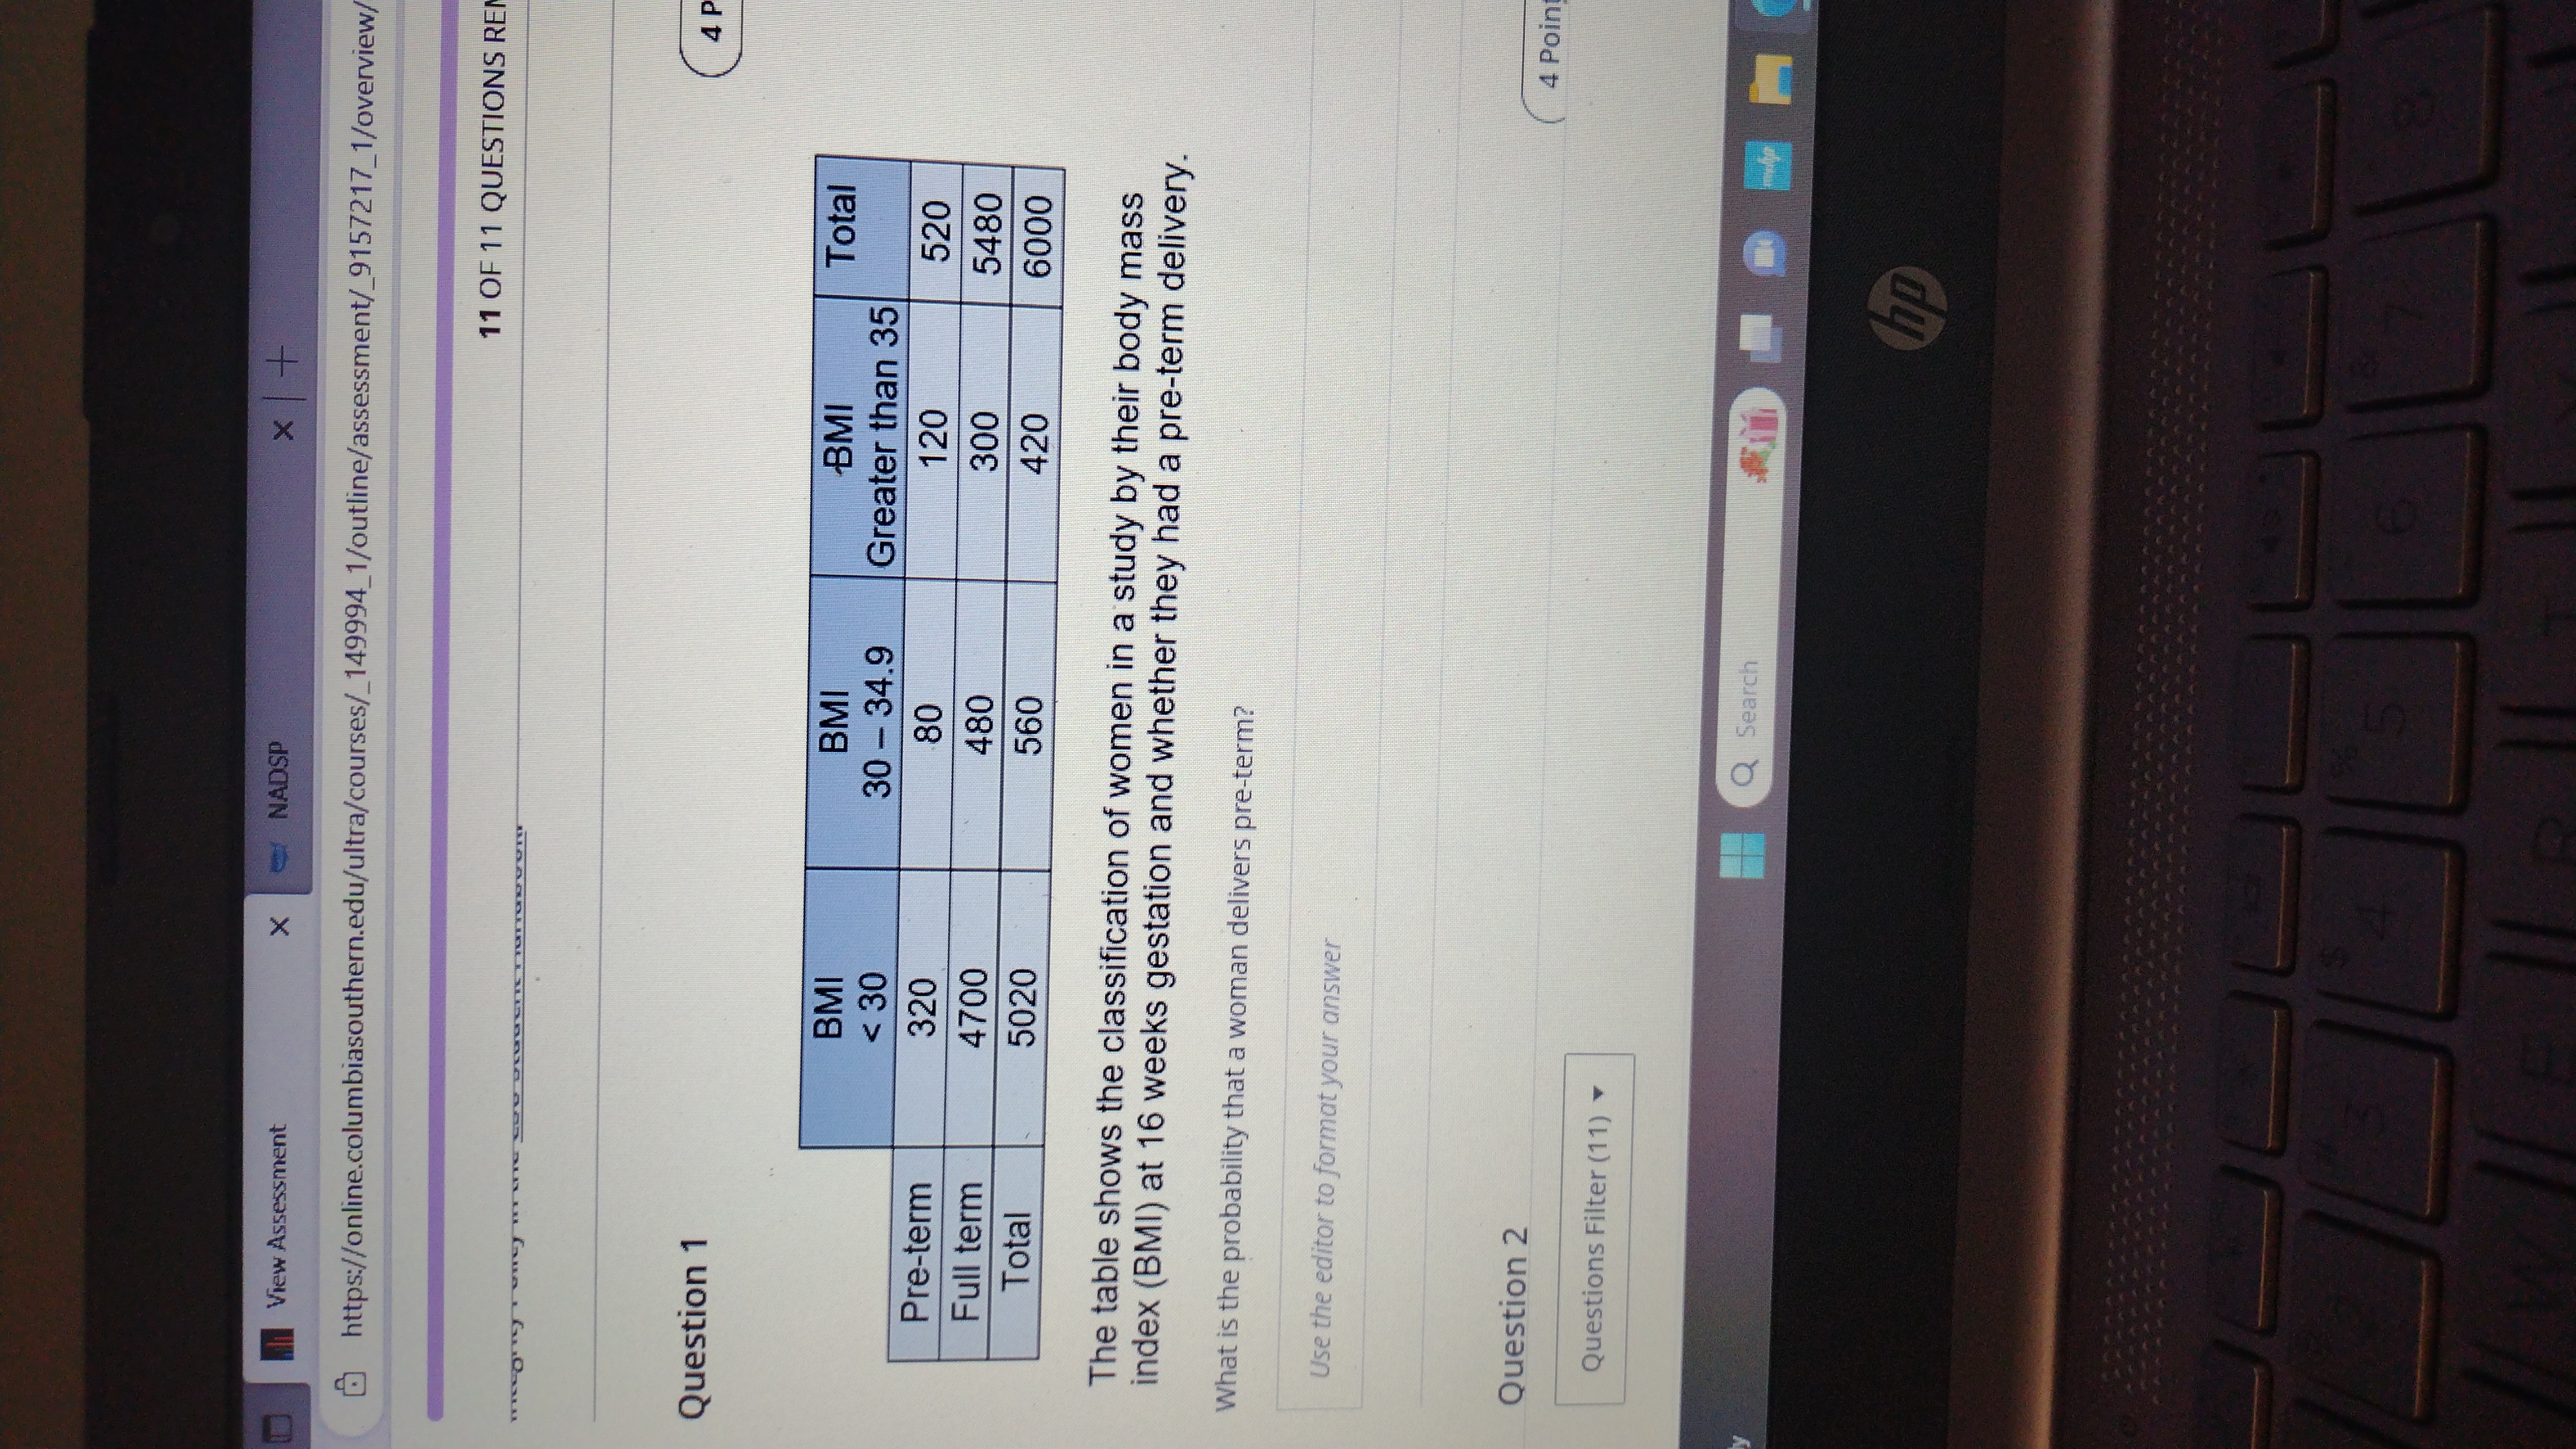
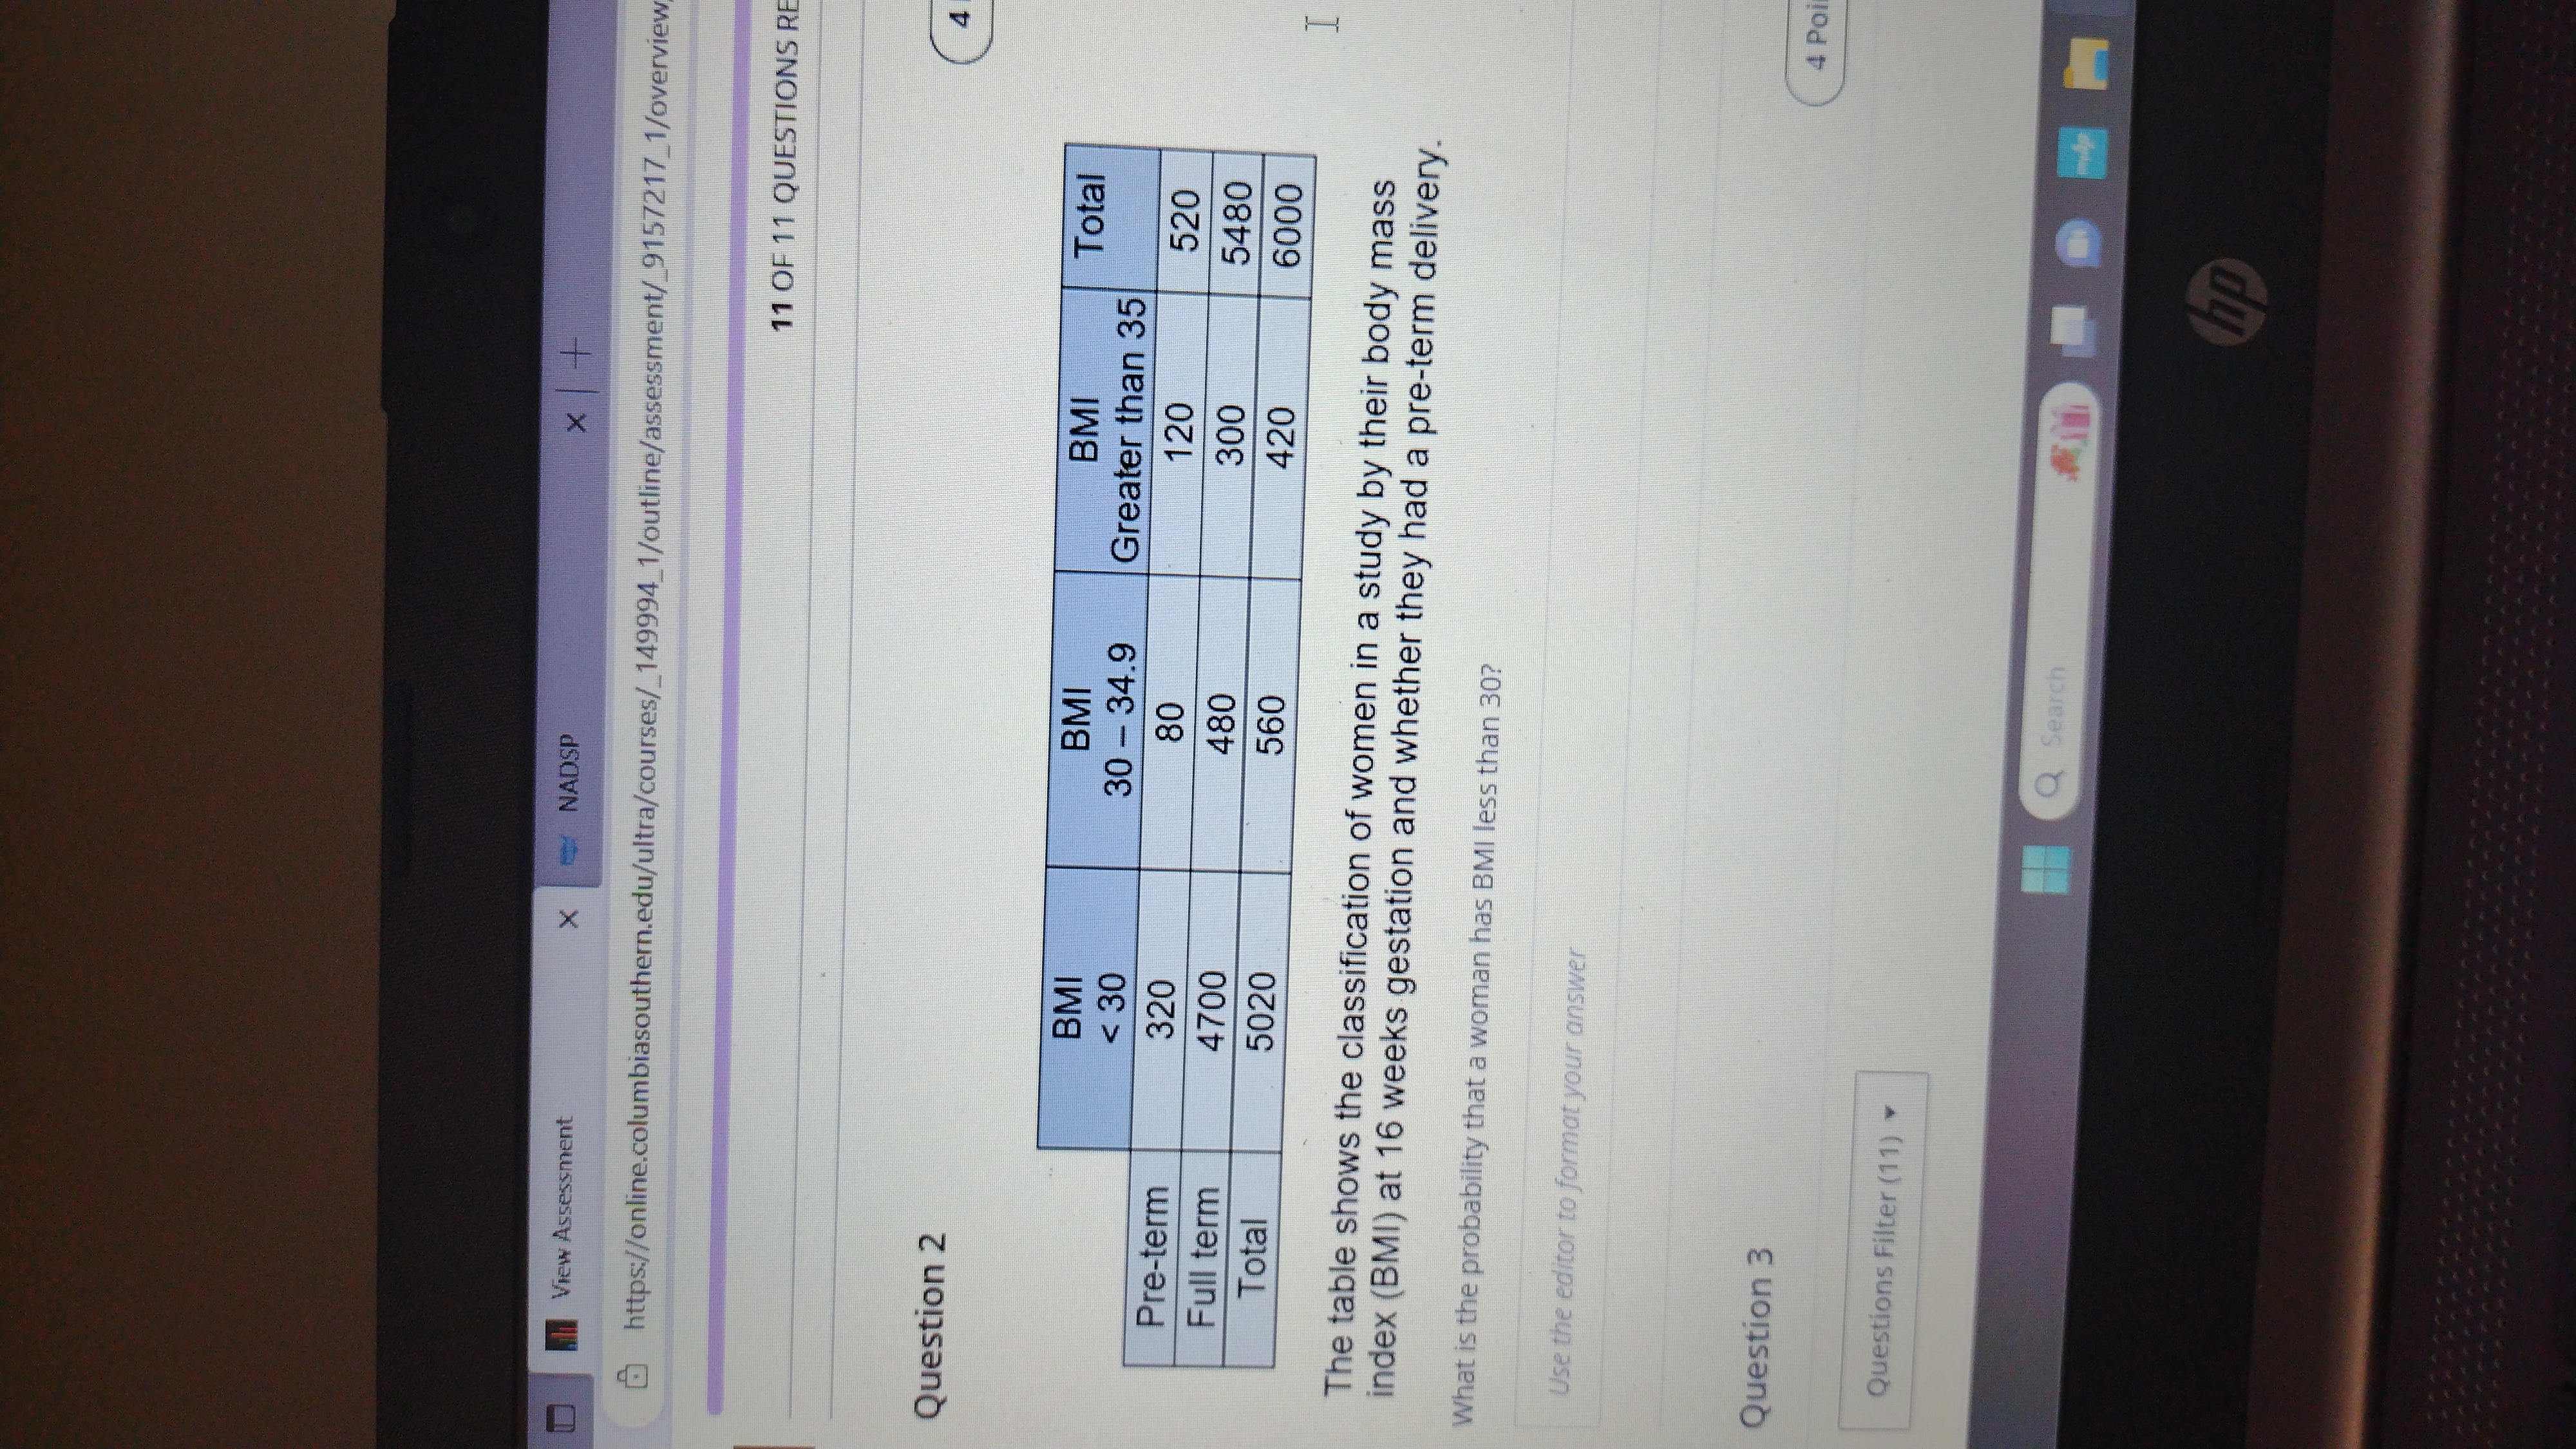
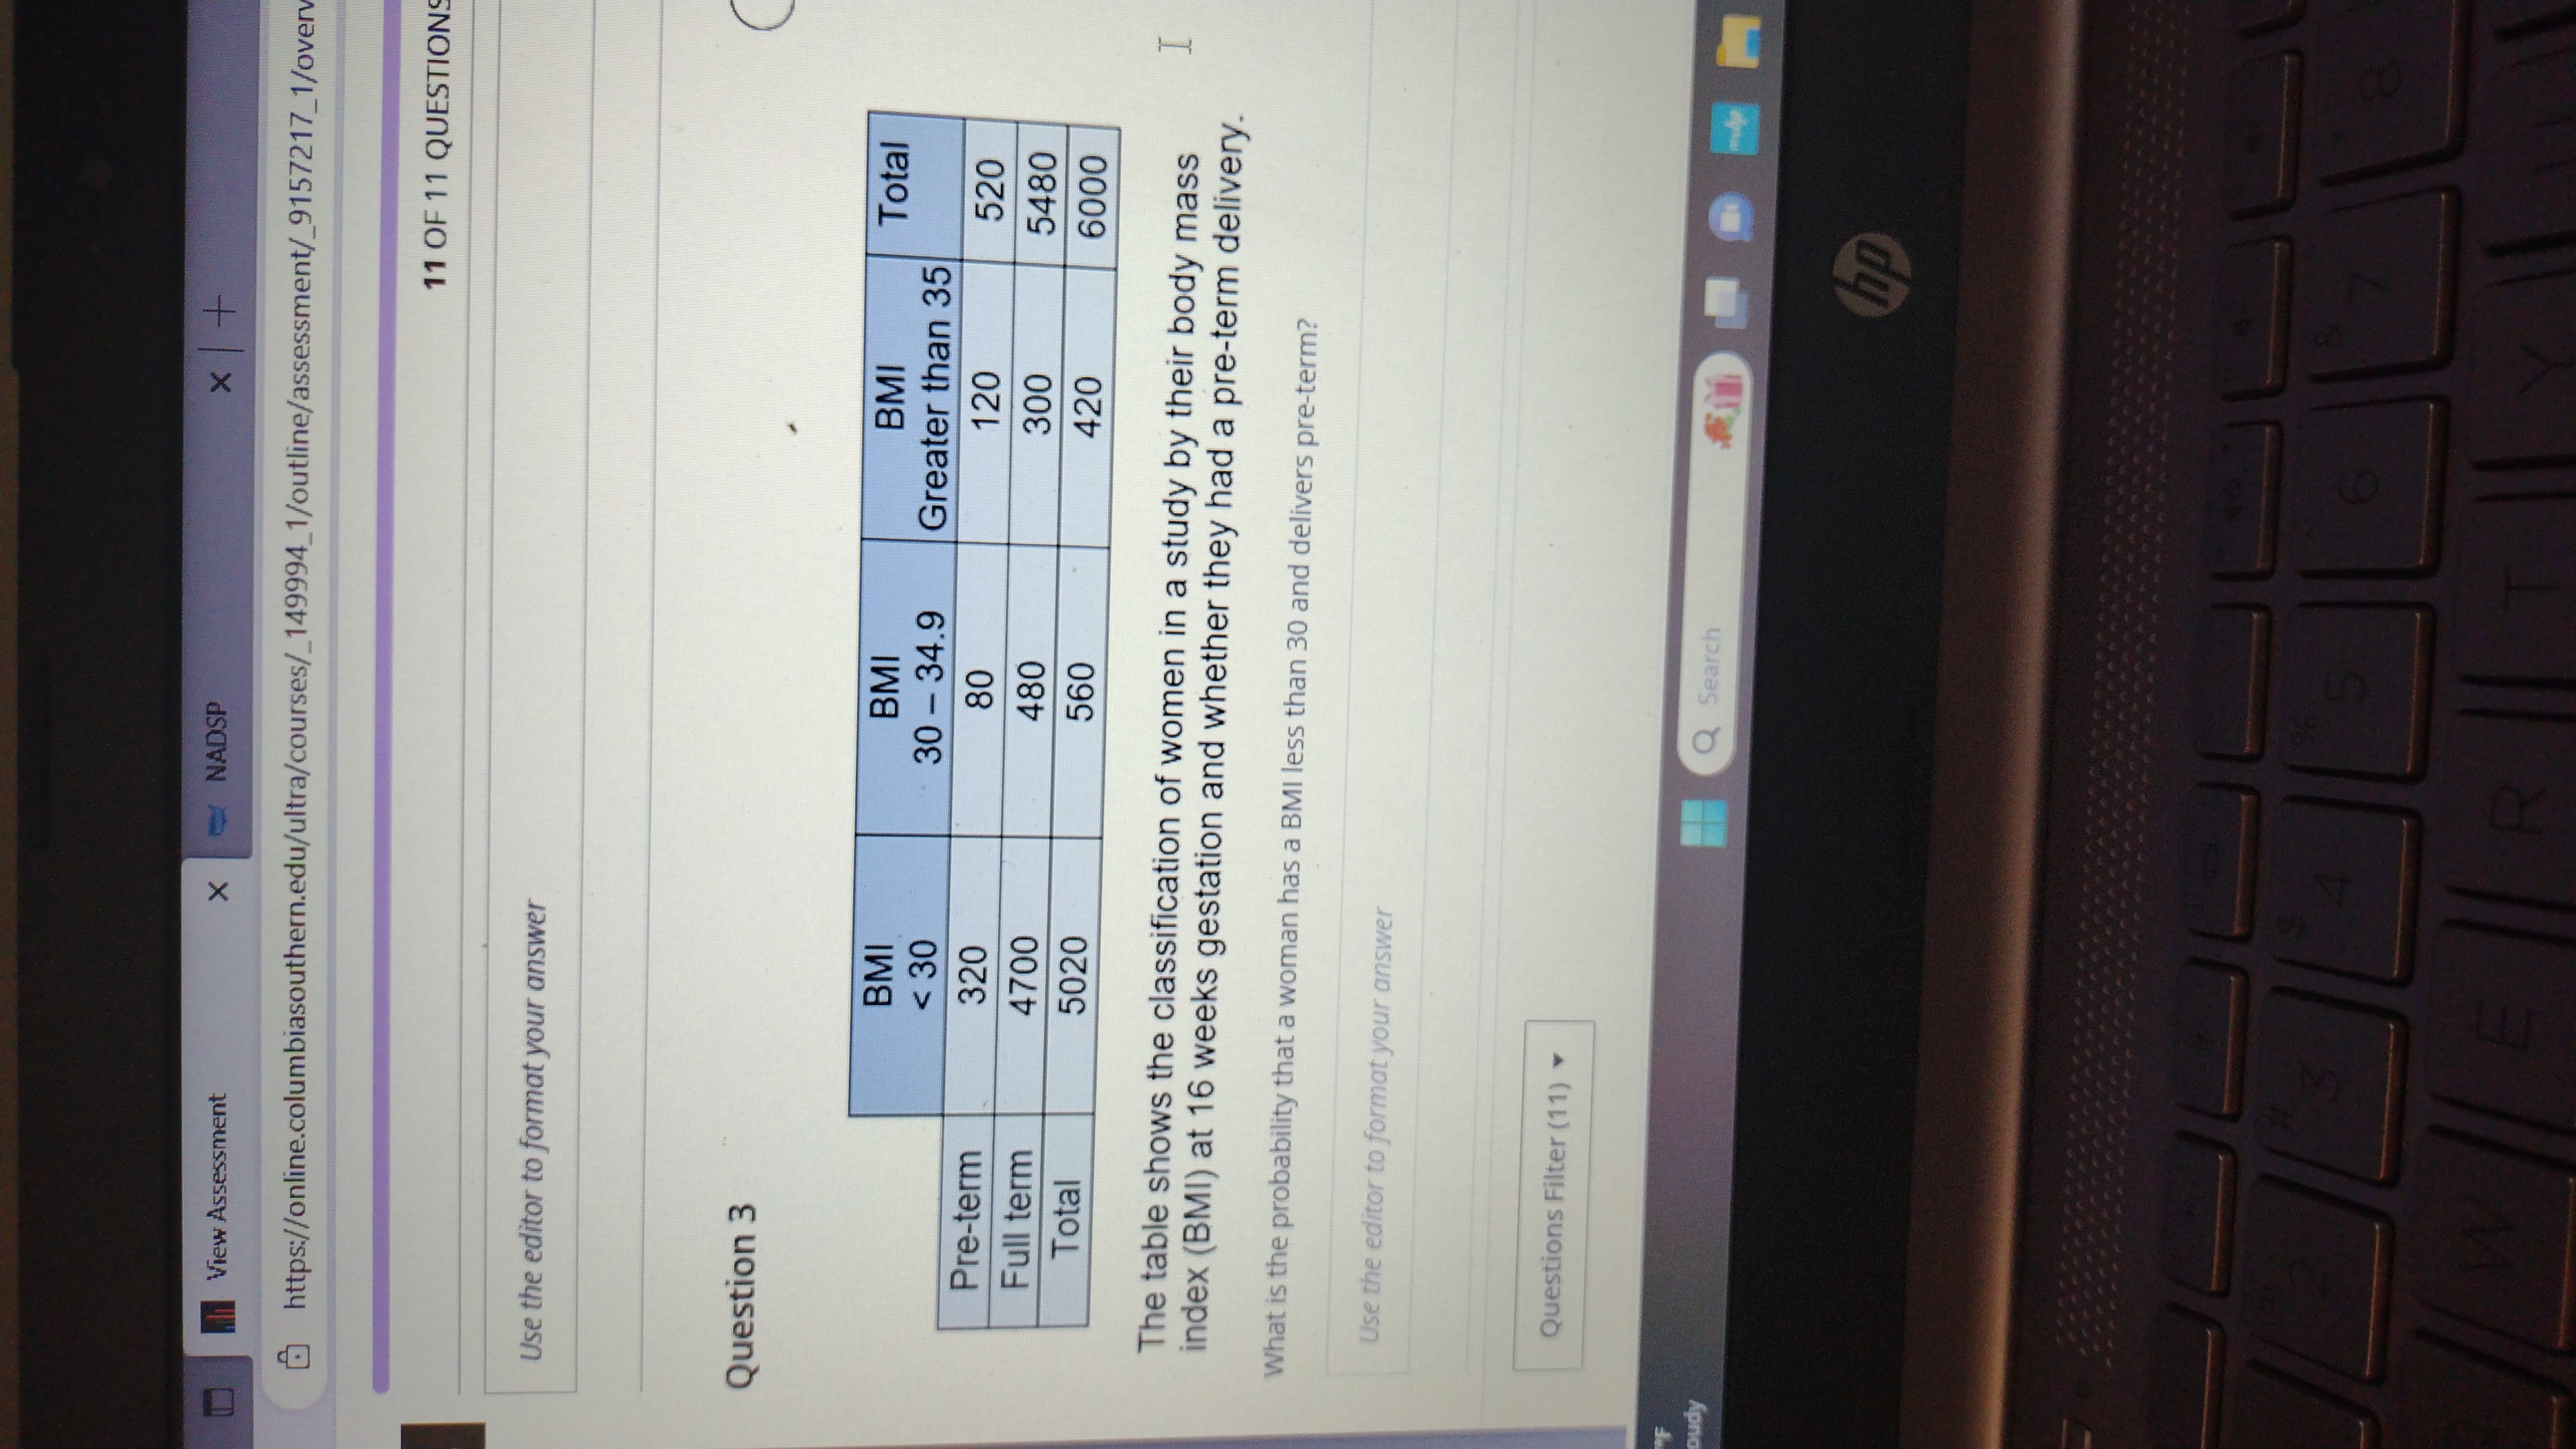
View Assessment X NADSP * + https://online.columbiasouthern.edu/ultra/courses/_149994_1/outline/assessment/_9157217_1/overview/ Question 1 11 OF 11 QUESTIONS REM BMI BMI...
Fantastic news! We've Found the answer you've been seeking!
Question:

Transcribed Image Text:
View Assessment X NADSP * + https://online.columbiasouthern.edu/ultra/courses/_149994_1/outline/assessment/_9157217_1/overview/ Question 1 11 OF 11 QUESTIONS REM BMI BMI BMI Total < 30 30-34.9 Greater than 35 Pre-term 320 80 120 520 Full term 4700 480 300 5480 Total 5020 560 420 6000 The table shows the classification of women in a study by their body mass index (BMI) at 16 weeks gestation and whether they had a pre-term delivery. What is the probability that a woman delivers pre-term? Use the editor to format your answer Question 2 Questions Filter (11) L Q Search hp 4 P 4 Point L View Assessment X NADSP https://online.columbiasouthern.edu/ultra/courses/_149994_1/outline/assessment/_9157217_1/overview Question 2 11 OF 11 QUESTIONS RE 4 BMI < 30 BMI 30 - 34.9 BMI Greater than 35 Total Pre-term 320 80 120 520 Full term 4700 480 300 5480 Total 5020 560 420 6000 I The table shows the classification of women in a study by their body mass index (BMI) at 16 weeks gestation and whether they had a pre-term delivery. What is the probability that a woman has BMI less than 30? Use the editor to format your answer Question 3 Questions Filter (11) Q Search hp 4 Poin F oudy View Assessment X NADSP x + https://online.columbiasouthern.edu/ultra/courses/_149994_1/outline/assessment/_9157217_1/overv Use the editor to format your answer Question 3 11 OF 11 QUESTIONS BMI < 30 BMI 30 - 34.9 BMI Greater than 35 Total Pre-term 320 80 120 520 Full term 4700 480 300 5480 Total 5020 560 420 6000 I The table shows the classification of women in a study by their body mass index (BMI) at 16 weeks gestation and whether they had a pre-term delivery. What is the probability that a woman has a BMI less than 30 and delivers pre-term? Use the editor to format your answer Questions Filter (11) P Q Search hp 80 View Assessment X NADSP + _ https://online.columbiasouthern.edu/ultra/courses/_149994_1/outline/assessment/_9157217_1/overvi Use the editor to format your answer Question 4 37F Cloudy 11 OF 11 QUESTIONS BMI BMI < 30 30 - 34.9 BMI Greater than 35 Total Pre-term 320 80 120 520 Full term 4700 480 300 5480 Total 5020 560 420 6000 The table shows the classification of women in a study by their body mass index (BMI) at 16 weeks gestation and whether they had a pre-term delivery. What proportion of women with a BMI greater than 35 delivers full-term? Use the editor to format your answer Questions Filter (11) Q Search hp J L View Assessment X NADSP * + https://online.columbiasouthern.edu/ultra/courses/_149994_1/outline/assessment/_9157217_1/overview/ Question 1 11 OF 11 QUESTIONS REM BMI BMI BMI Total < 30 30-34.9 Greater than 35 Pre-term 320 80 120 520 Full term 4700 480 300 5480 Total 5020 560 420 6000 The table shows the classification of women in a study by their body mass index (BMI) at 16 weeks gestation and whether they had a pre-term delivery. What is the probability that a woman delivers pre-term? Use the editor to format your answer Question 2 Questions Filter (11) L Q Search hp 4 P 4 Point L View Assessment X NADSP https://online.columbiasouthern.edu/ultra/courses/_149994_1/outline/assessment/_9157217_1/overview Question 2 11 OF 11 QUESTIONS RE 4 BMI < 30 BMI 30 - 34.9 BMI Greater than 35 Total Pre-term 320 80 120 520 Full term 4700 480 300 5480 Total 5020 560 420 6000 I The table shows the classification of women in a study by their body mass index (BMI) at 16 weeks gestation and whether they had a pre-term delivery. What is the probability that a woman has BMI less than 30? Use the editor to format your answer Question 3 Questions Filter (11) Q Search hp 4 Poin F oudy View Assessment X NADSP x + https://online.columbiasouthern.edu/ultra/courses/_149994_1/outline/assessment/_9157217_1/overv Use the editor to format your answer Question 3 11 OF 11 QUESTIONS BMI < 30 BMI 30 - 34.9 BMI Greater than 35 Total Pre-term 320 80 120 520 Full term 4700 480 300 5480 Total 5020 560 420 6000 I The table shows the classification of women in a study by their body mass index (BMI) at 16 weeks gestation and whether they had a pre-term delivery. What is the probability that a woman has a BMI less than 30 and delivers pre-term? Use the editor to format your answer Questions Filter (11) P Q Search hp 80 View Assessment X NADSP + _ https://online.columbiasouthern.edu/ultra/courses/_149994_1/outline/assessment/_9157217_1/overvi Use the editor to format your answer Question 4 37F Cloudy 11 OF 11 QUESTIONS BMI BMI < 30 30 - 34.9 BMI Greater than 35 Total Pre-term 320 80 120 520 Full term 4700 480 300 5480 Total 5020 560 420 6000 The table shows the classification of women in a study by their body mass index (BMI) at 16 weeks gestation and whether they had a pre-term delivery. What proportion of women with a BMI greater than 35 delivers full-term? Use the editor to format your answer Questions Filter (11) Q Search hp J L
Expert Answer:

Posted Date:
Students also viewed these mathematics questions
-
Jiayi Holdings Ltd imports wine from Australia into Singapore. It's considering an expansion in its business by also supplying Australian produced gins and whiskey to Singapore which are then sold to...
-
What is the expected value of the first order statistic when using uniform distribution?
-
4. Answer the following questions relating to sampling distributions: a. What is the difference between the sample size and the number of samples? b. What is the difference between a population...
-
Using Dirac delta functions in the appropriate coordinates, express the following charge distributions as three-dimensional charge densities p(x). (a) In spherical coordinates, a charge Q uniformly...
-
The marketing vice president of Consolidated Appliances has asked you to develop a regression model to predict consumption of durable goods as a function of disposable personal income and other...
-
Describe the limitations of project management.
-
What relationship is represented by the price-earnings ratio?
-
Journalize the following transactions for Dewey, Inc. (a) Incurred direct labor costs of $24,000 for 3,000 hours. The standard labor cost was $25,500. (b) Assigned 3,000 direct labor hours costing...
-
To access an array element, use the array name and the elements A. name. B. data type. C. subscript. D. value. E. size declarator.
-
With the aid of the diagram, illustrate and discuss the four contingencies in the entrepreneurial process as presented in the case study below....
-
In the control environment, proper segregation of duties calls for separation of the a. Authorization, recording, and custodial functions. b. Authorization, execution, and payment functions. c....
-
Solve the line balancing problem given in the following table with a cycle time of 100 seconds: Task T1 T2 T3 T4 T5 T6 17 Time (seconds) 35 30 45 25 50 47 55 Required Precedence Tasks T1 T1 T1 T4 T2,...
-
The primary purpose of the auditor acquiring an understanding of the internal control structure is to a. Determine whether documents and records are reliable. b. Make constructive suggestions to...
-
The best internal control structure procedure to ensure that payroll checks are not being paid to improper or nonexistent employees is to a. Prepare one check for the total amount of the payroll. b....
-
Described below are some characteristics of the three elements of a companys internal control structure. Required: Identify each description as relating to the control environment, accounting system,...
-
Julie flips a fair coin., If the coin lands head-up, she puts $10 in envelope one and $100 in envelope two. If the coin lands tails-up she puts $100 in envelope one and $1,000 in envelope two. She...
-
You are standing at x = 9.0 km and your assistant is standing at x = 3.0 km. Lightning bolt 1 strikes at x = 0 km and lightning bolt 2 strikes at x = 12.0 km. You see the flash from bolt 2 at t = 10...
-
An experiment with a probability of success given as 0.30 is repeated 90 times. Use the normal distribution to approximate the binomial distribution, and find the probability the experiment will have...
-
A multiple choice test has a probability any question will be guesses correctly of 0.25. There are 100 questions, and a student guesses at all of them. Use the normal distribution to approximate the...
-
Thuy Dau, Ngoc Bui, Sam Su, and Lan Voung conducted a survey as to how long customers at Lucky claimed to wait in the checkout line until their turn. Let X = time in line. Table 6.1 displays the...

Study smarter with the SolutionInn App