Question: View Home Insert Draw Page Layout Formulas Data Review Dev File Arial v9 - AA Wrap Text General Paste BIU Merge & Center o Clipboard
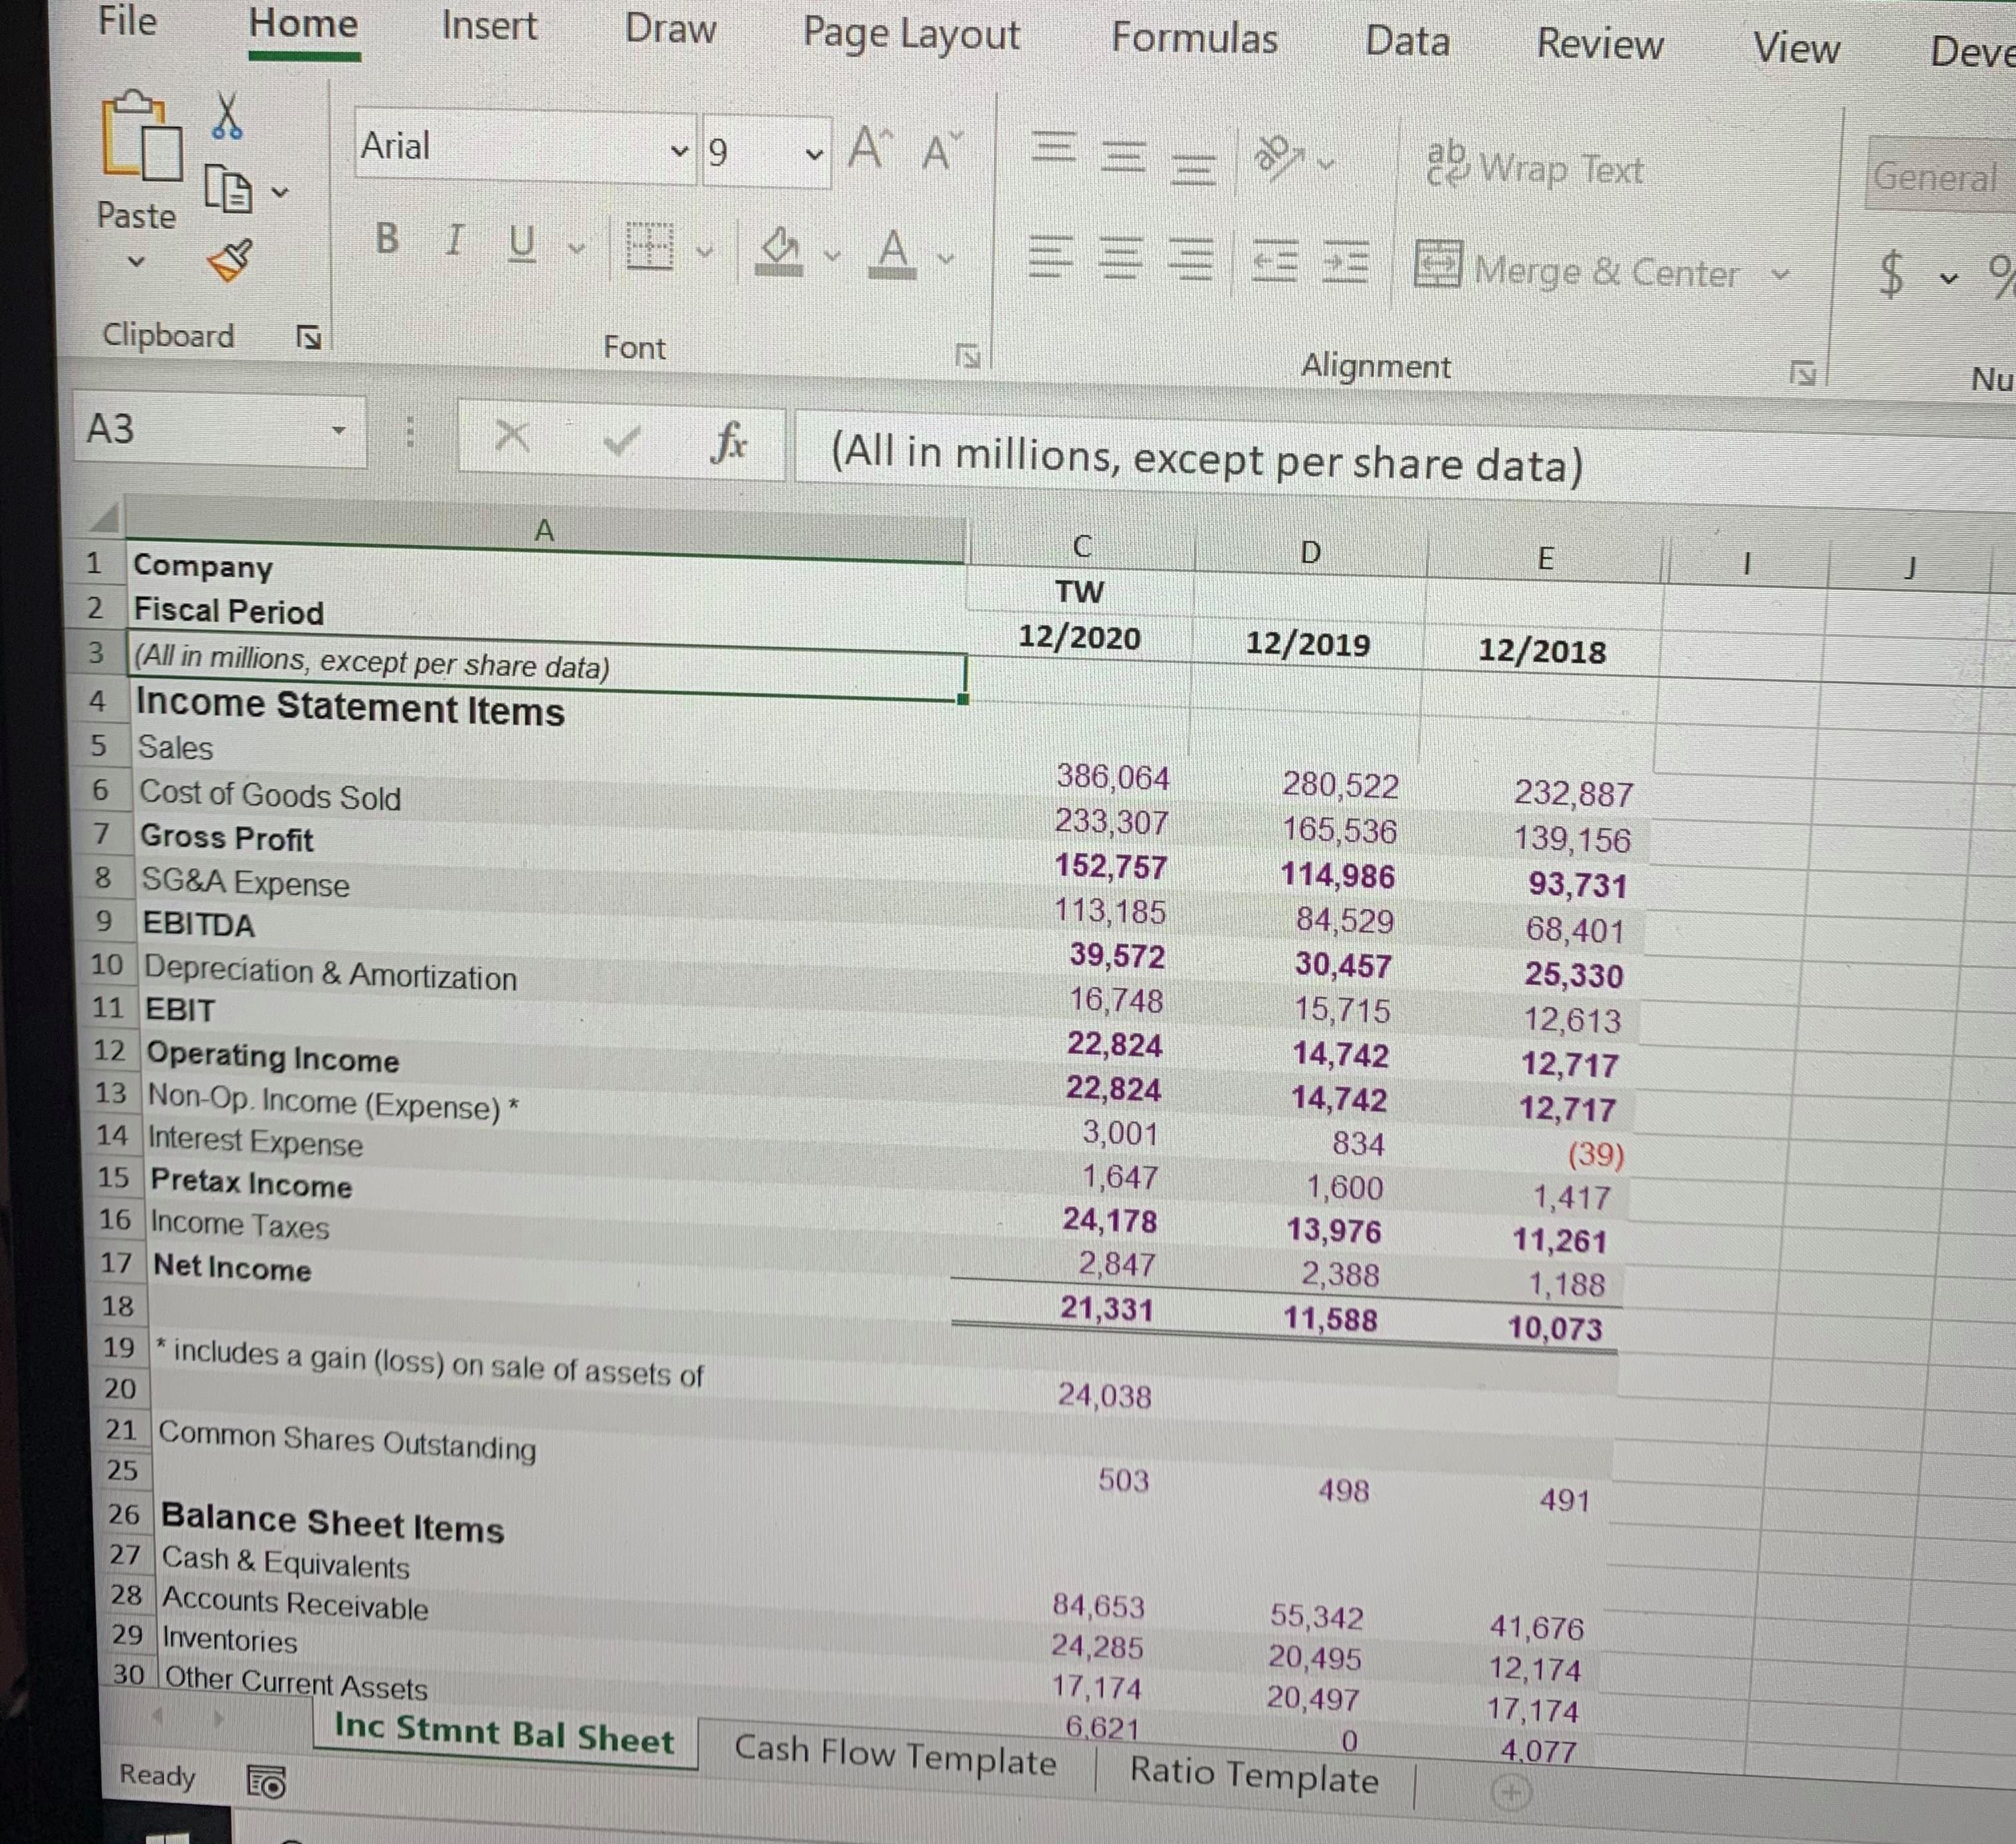
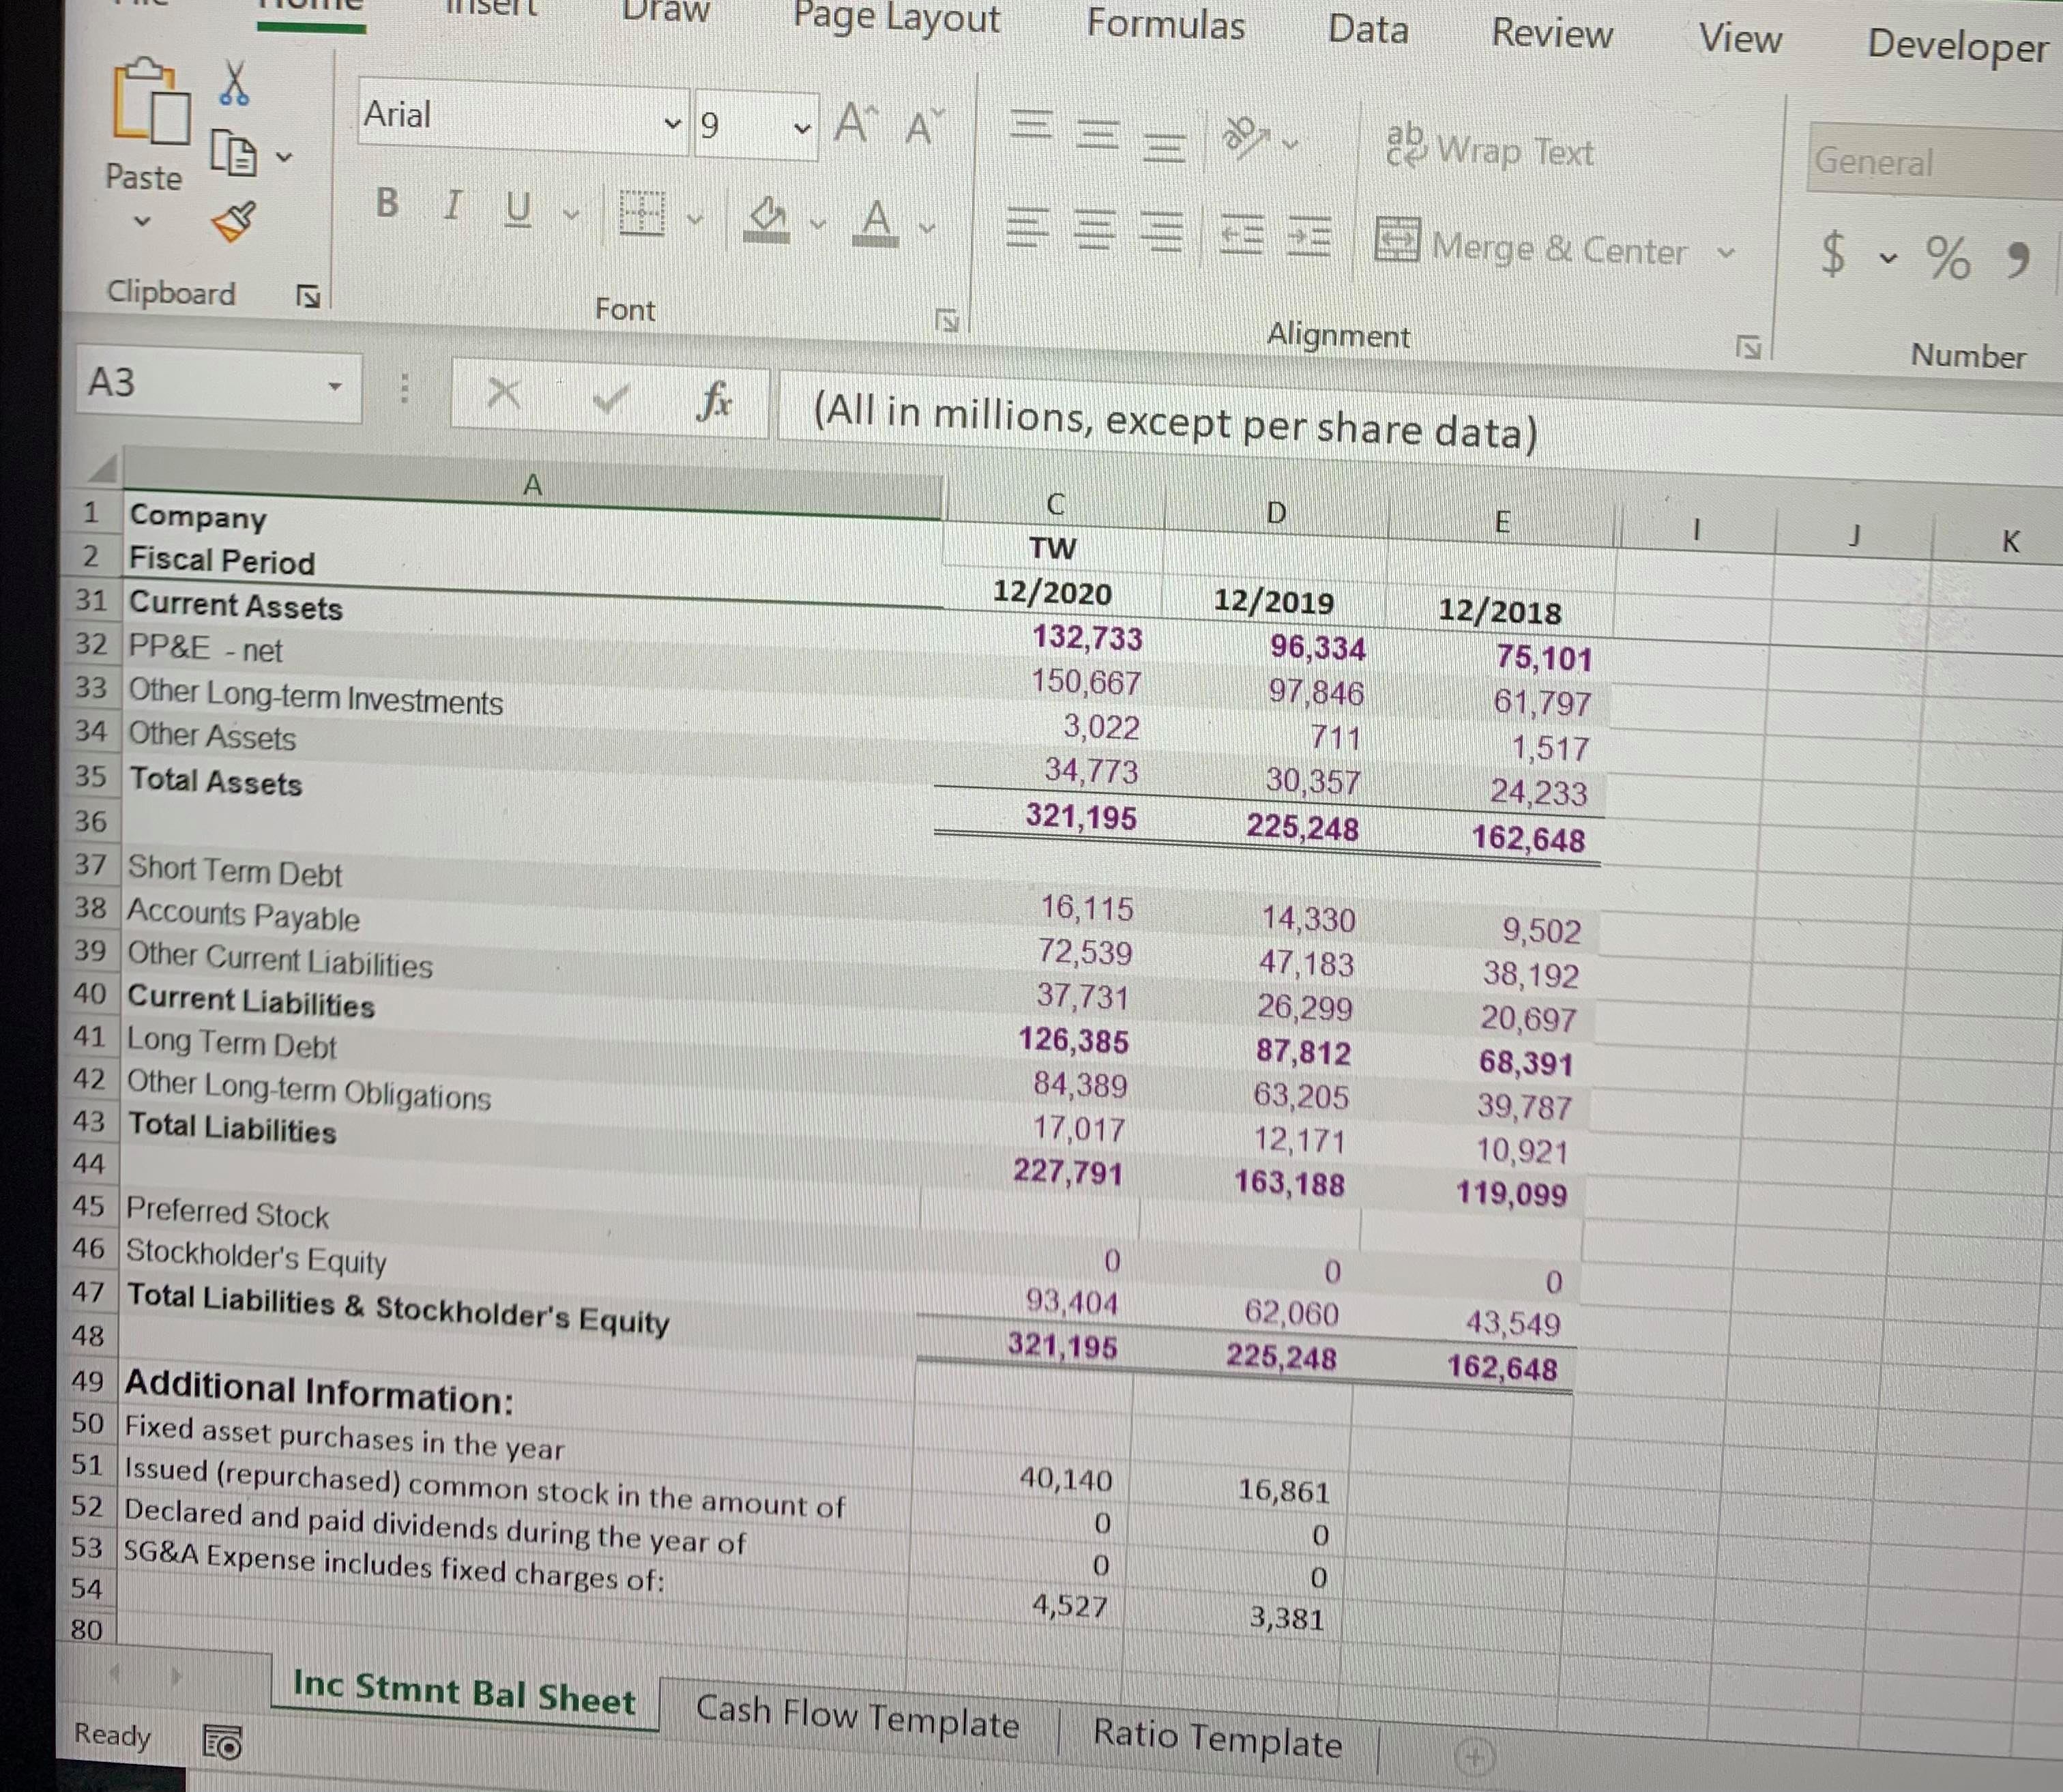
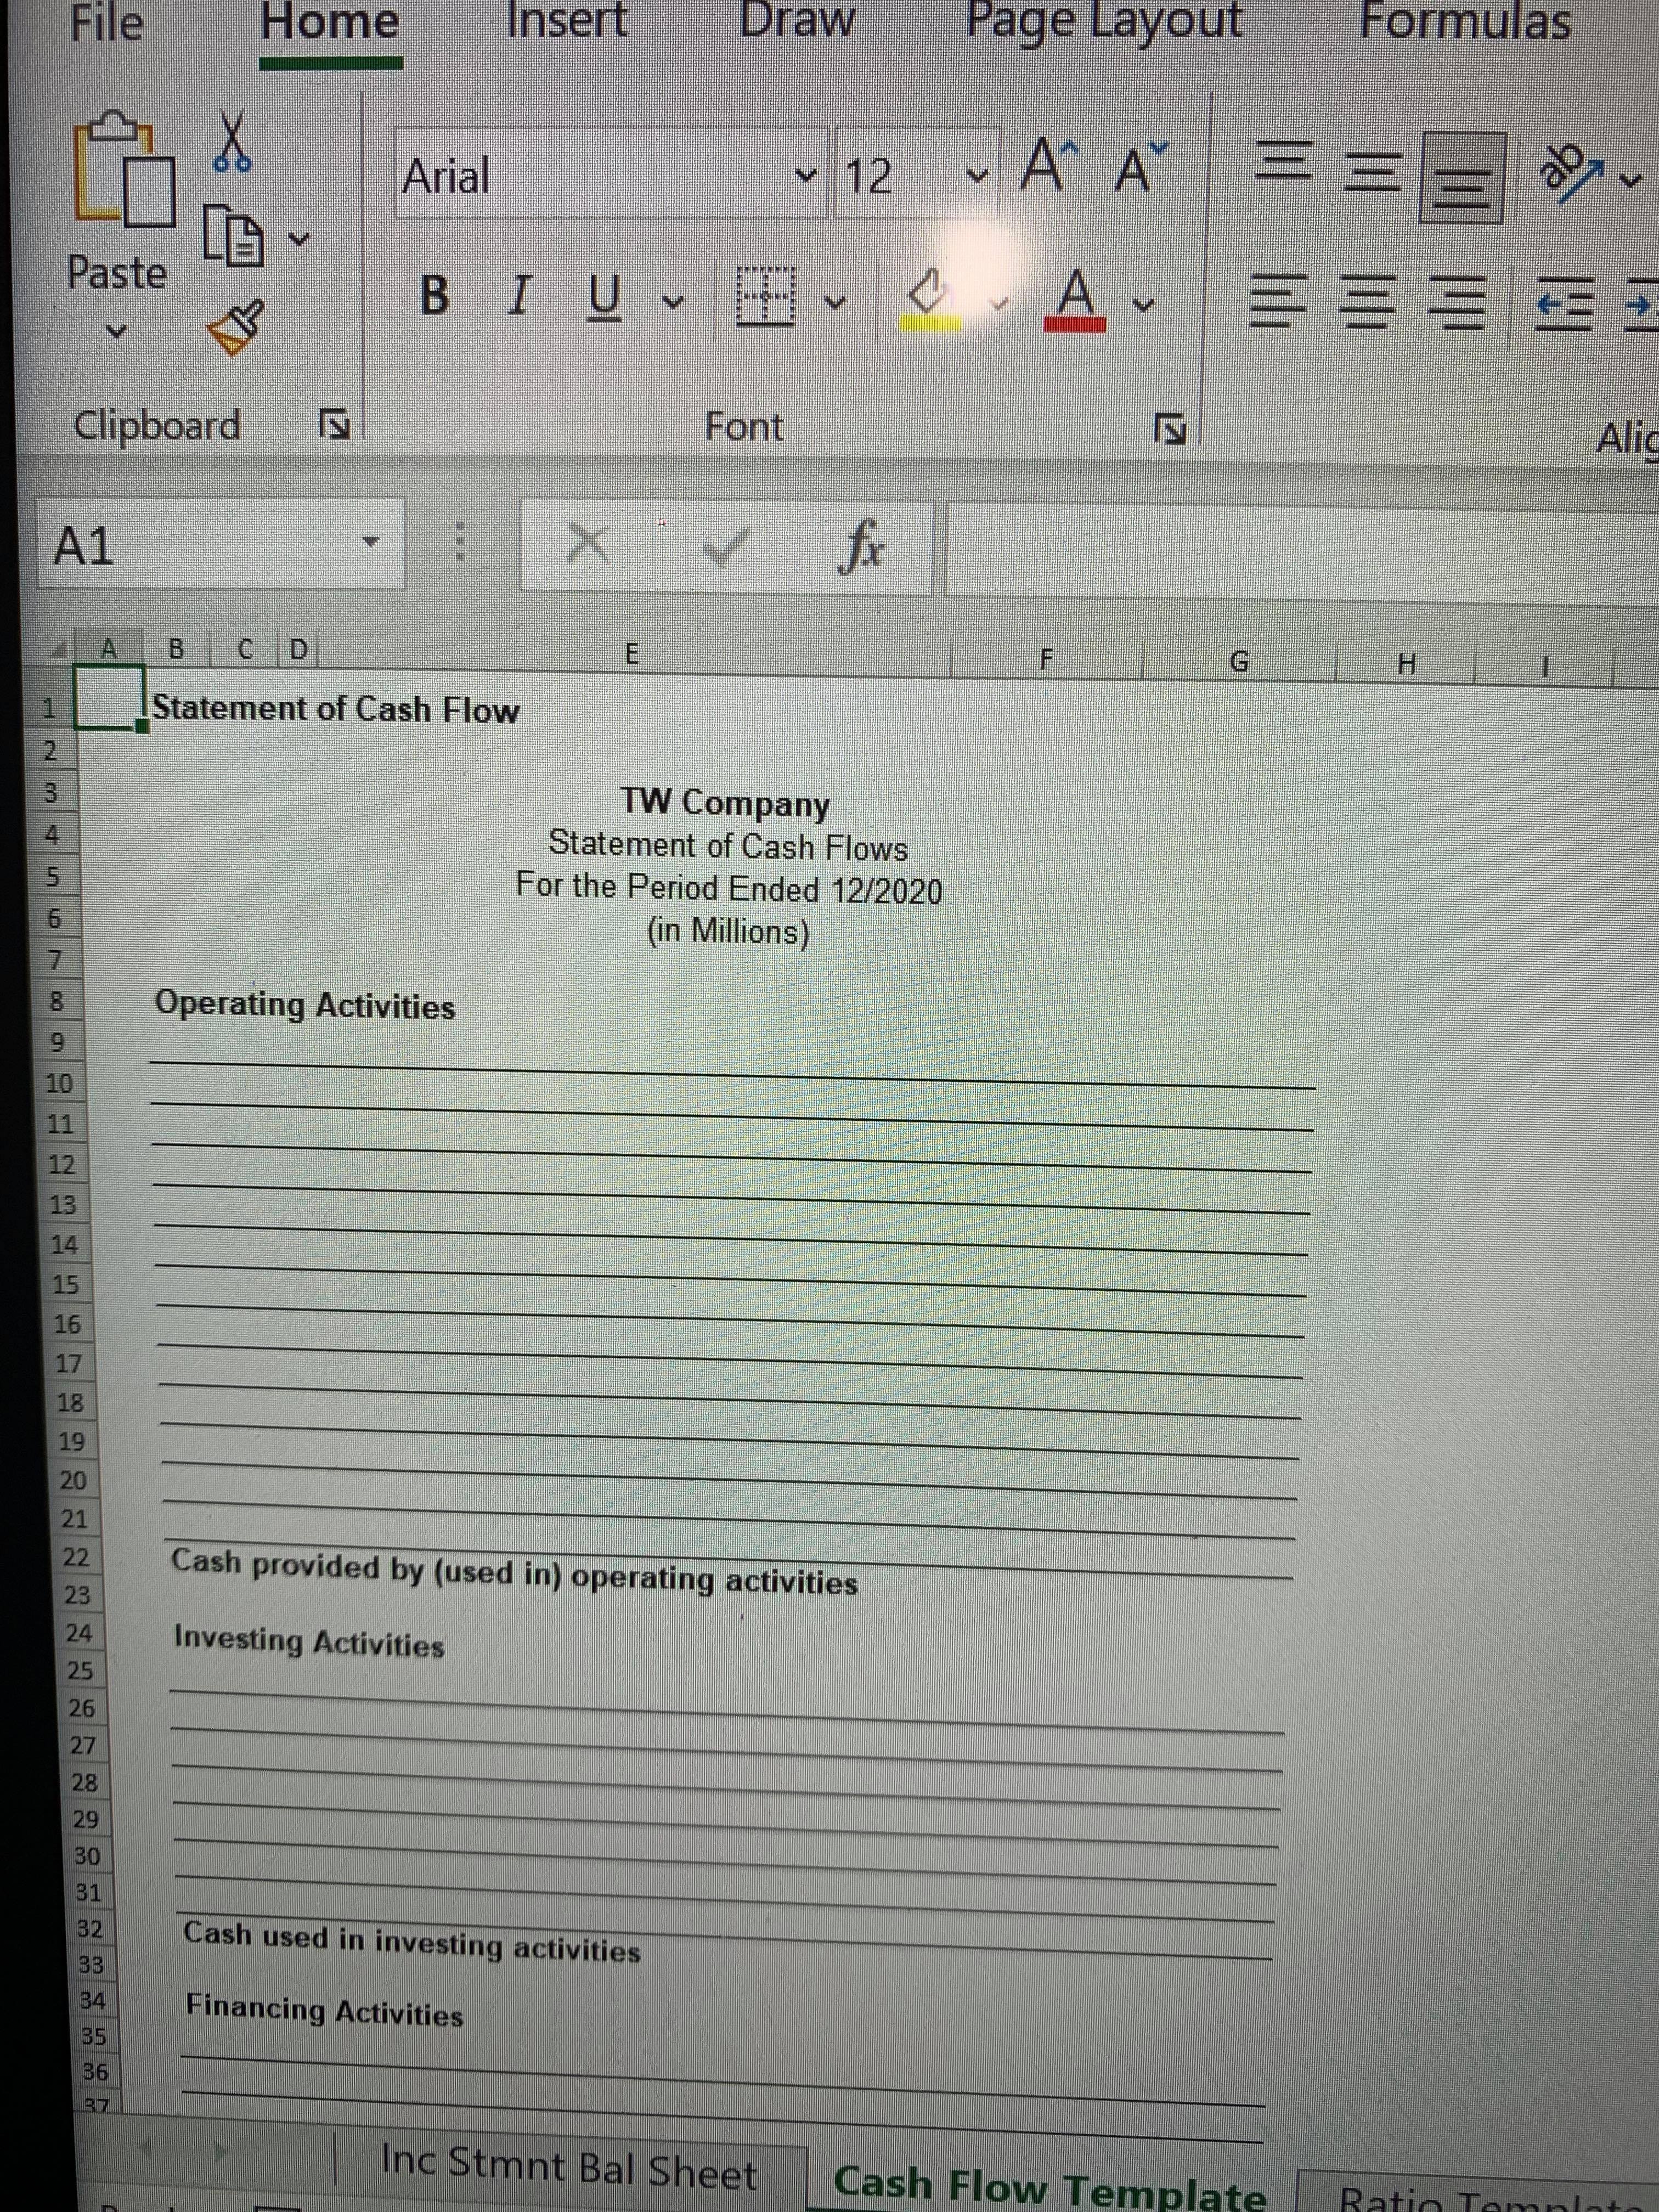
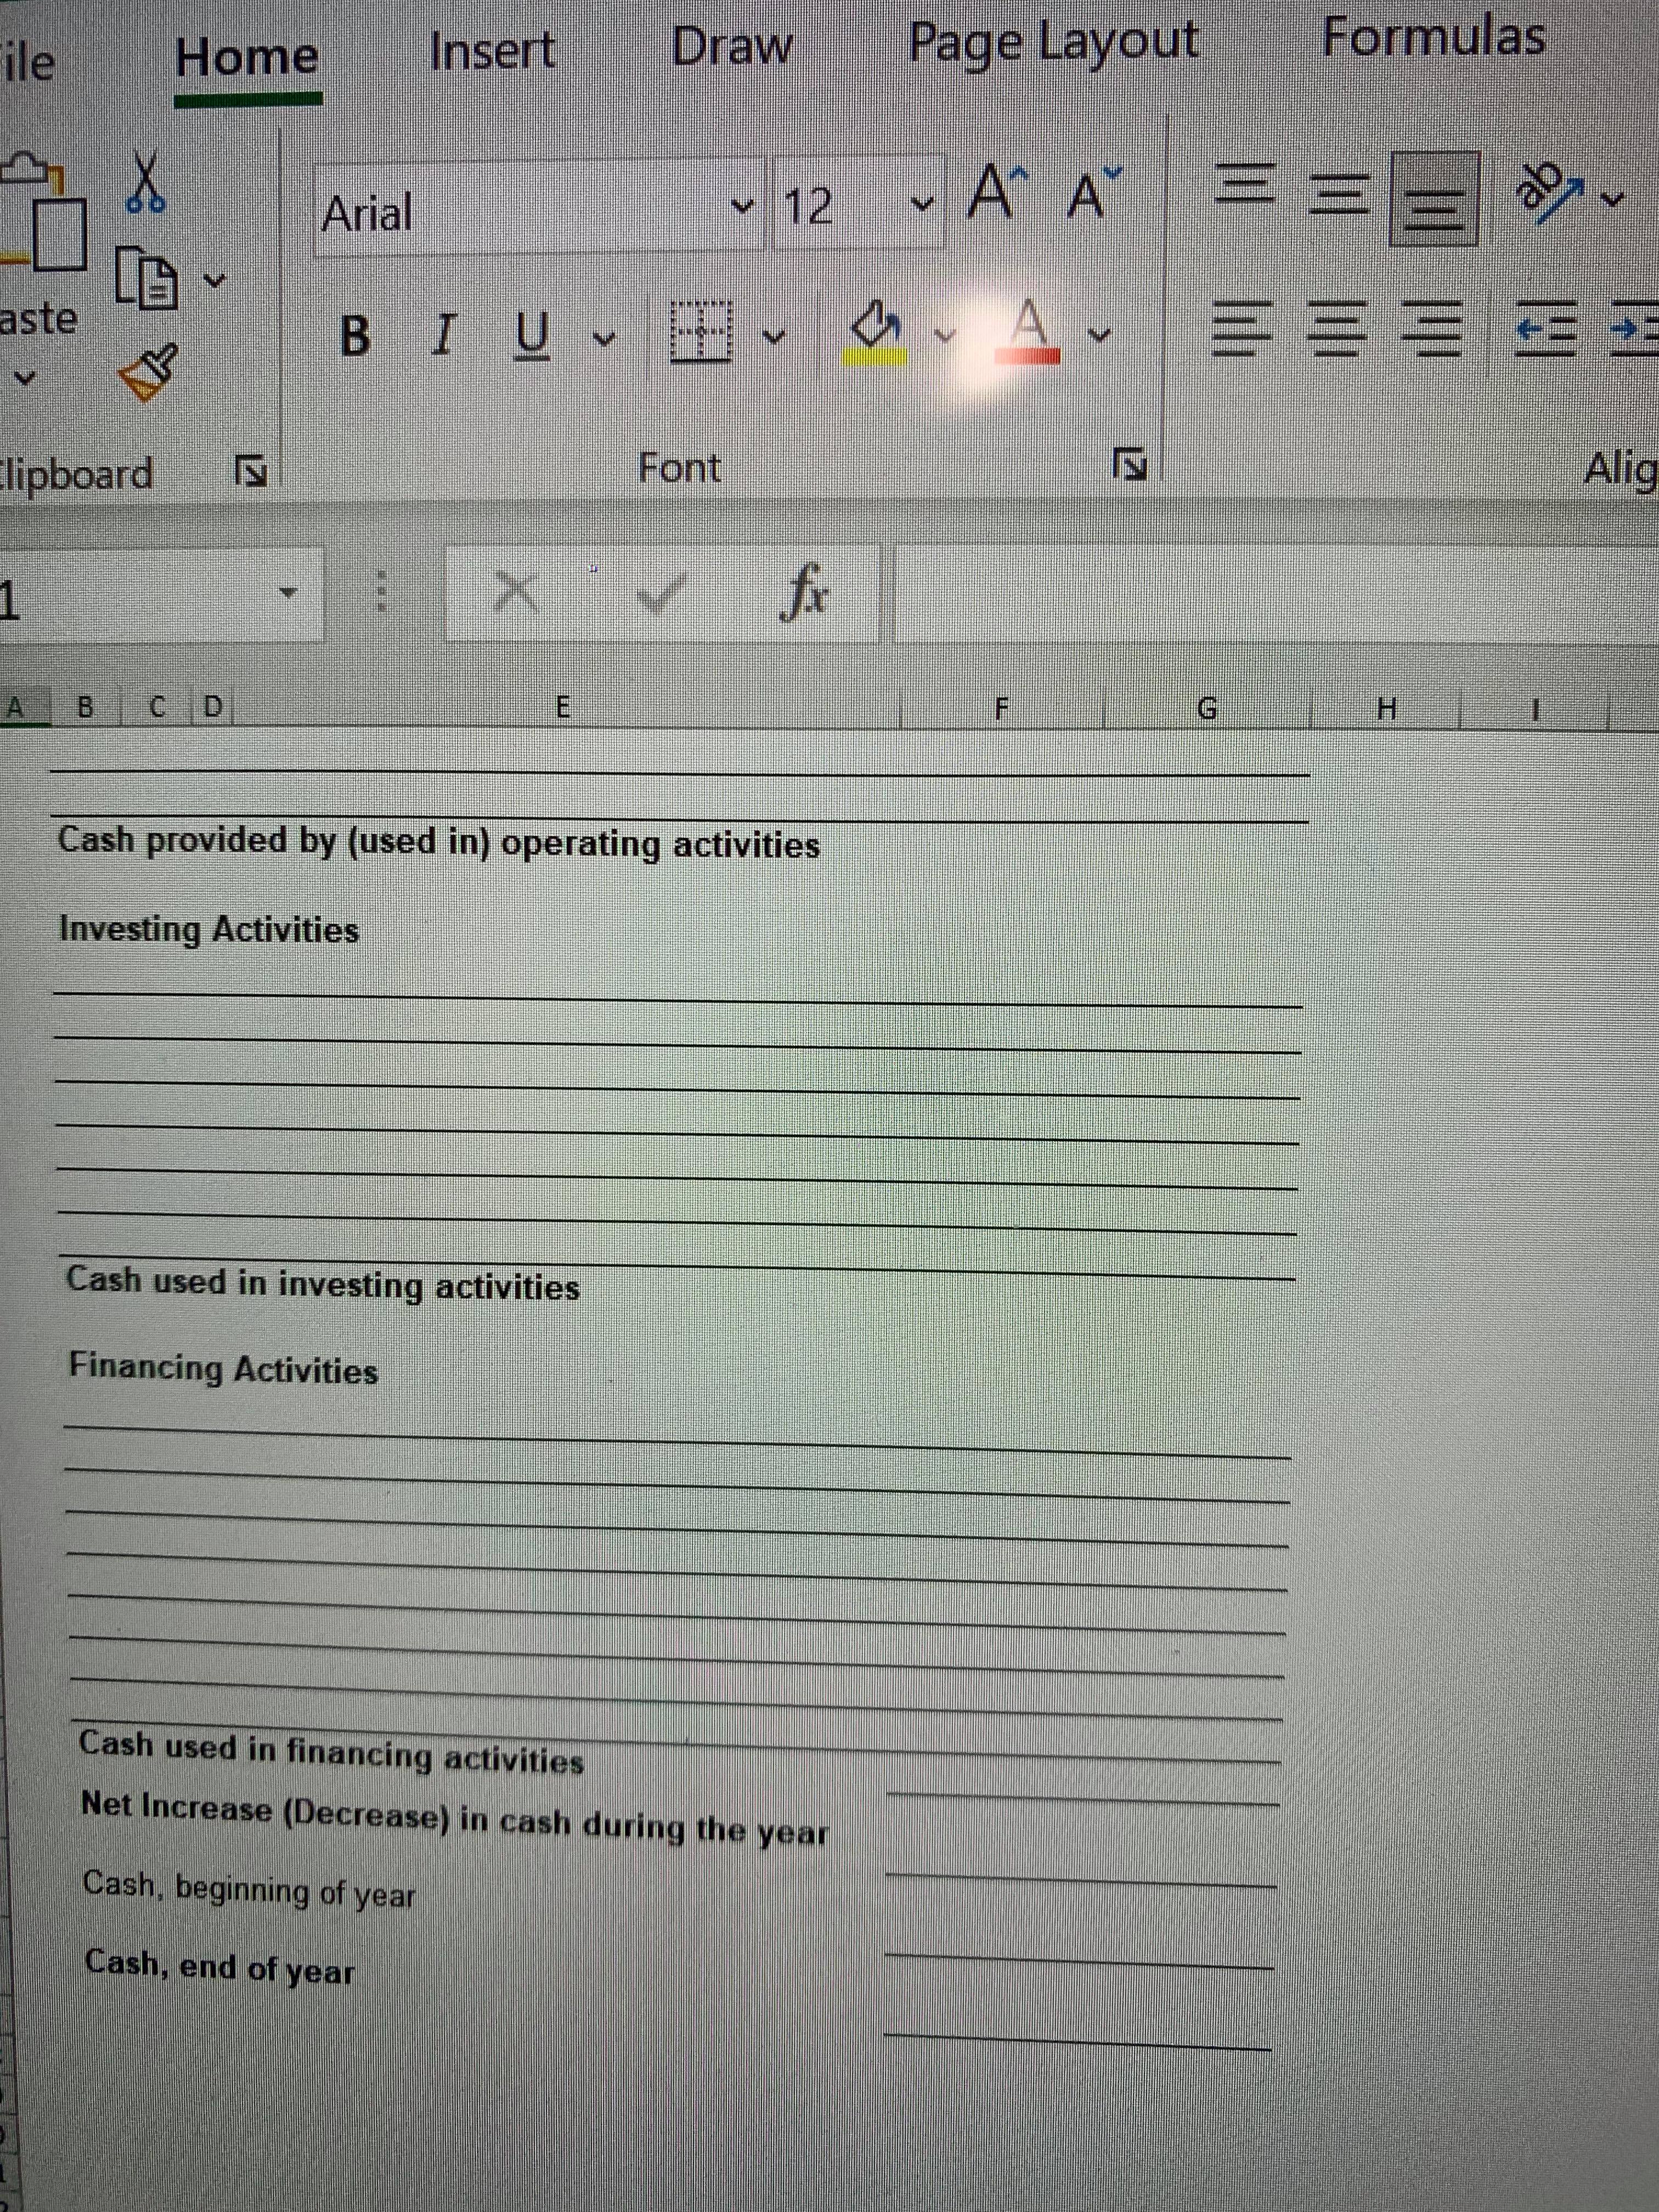
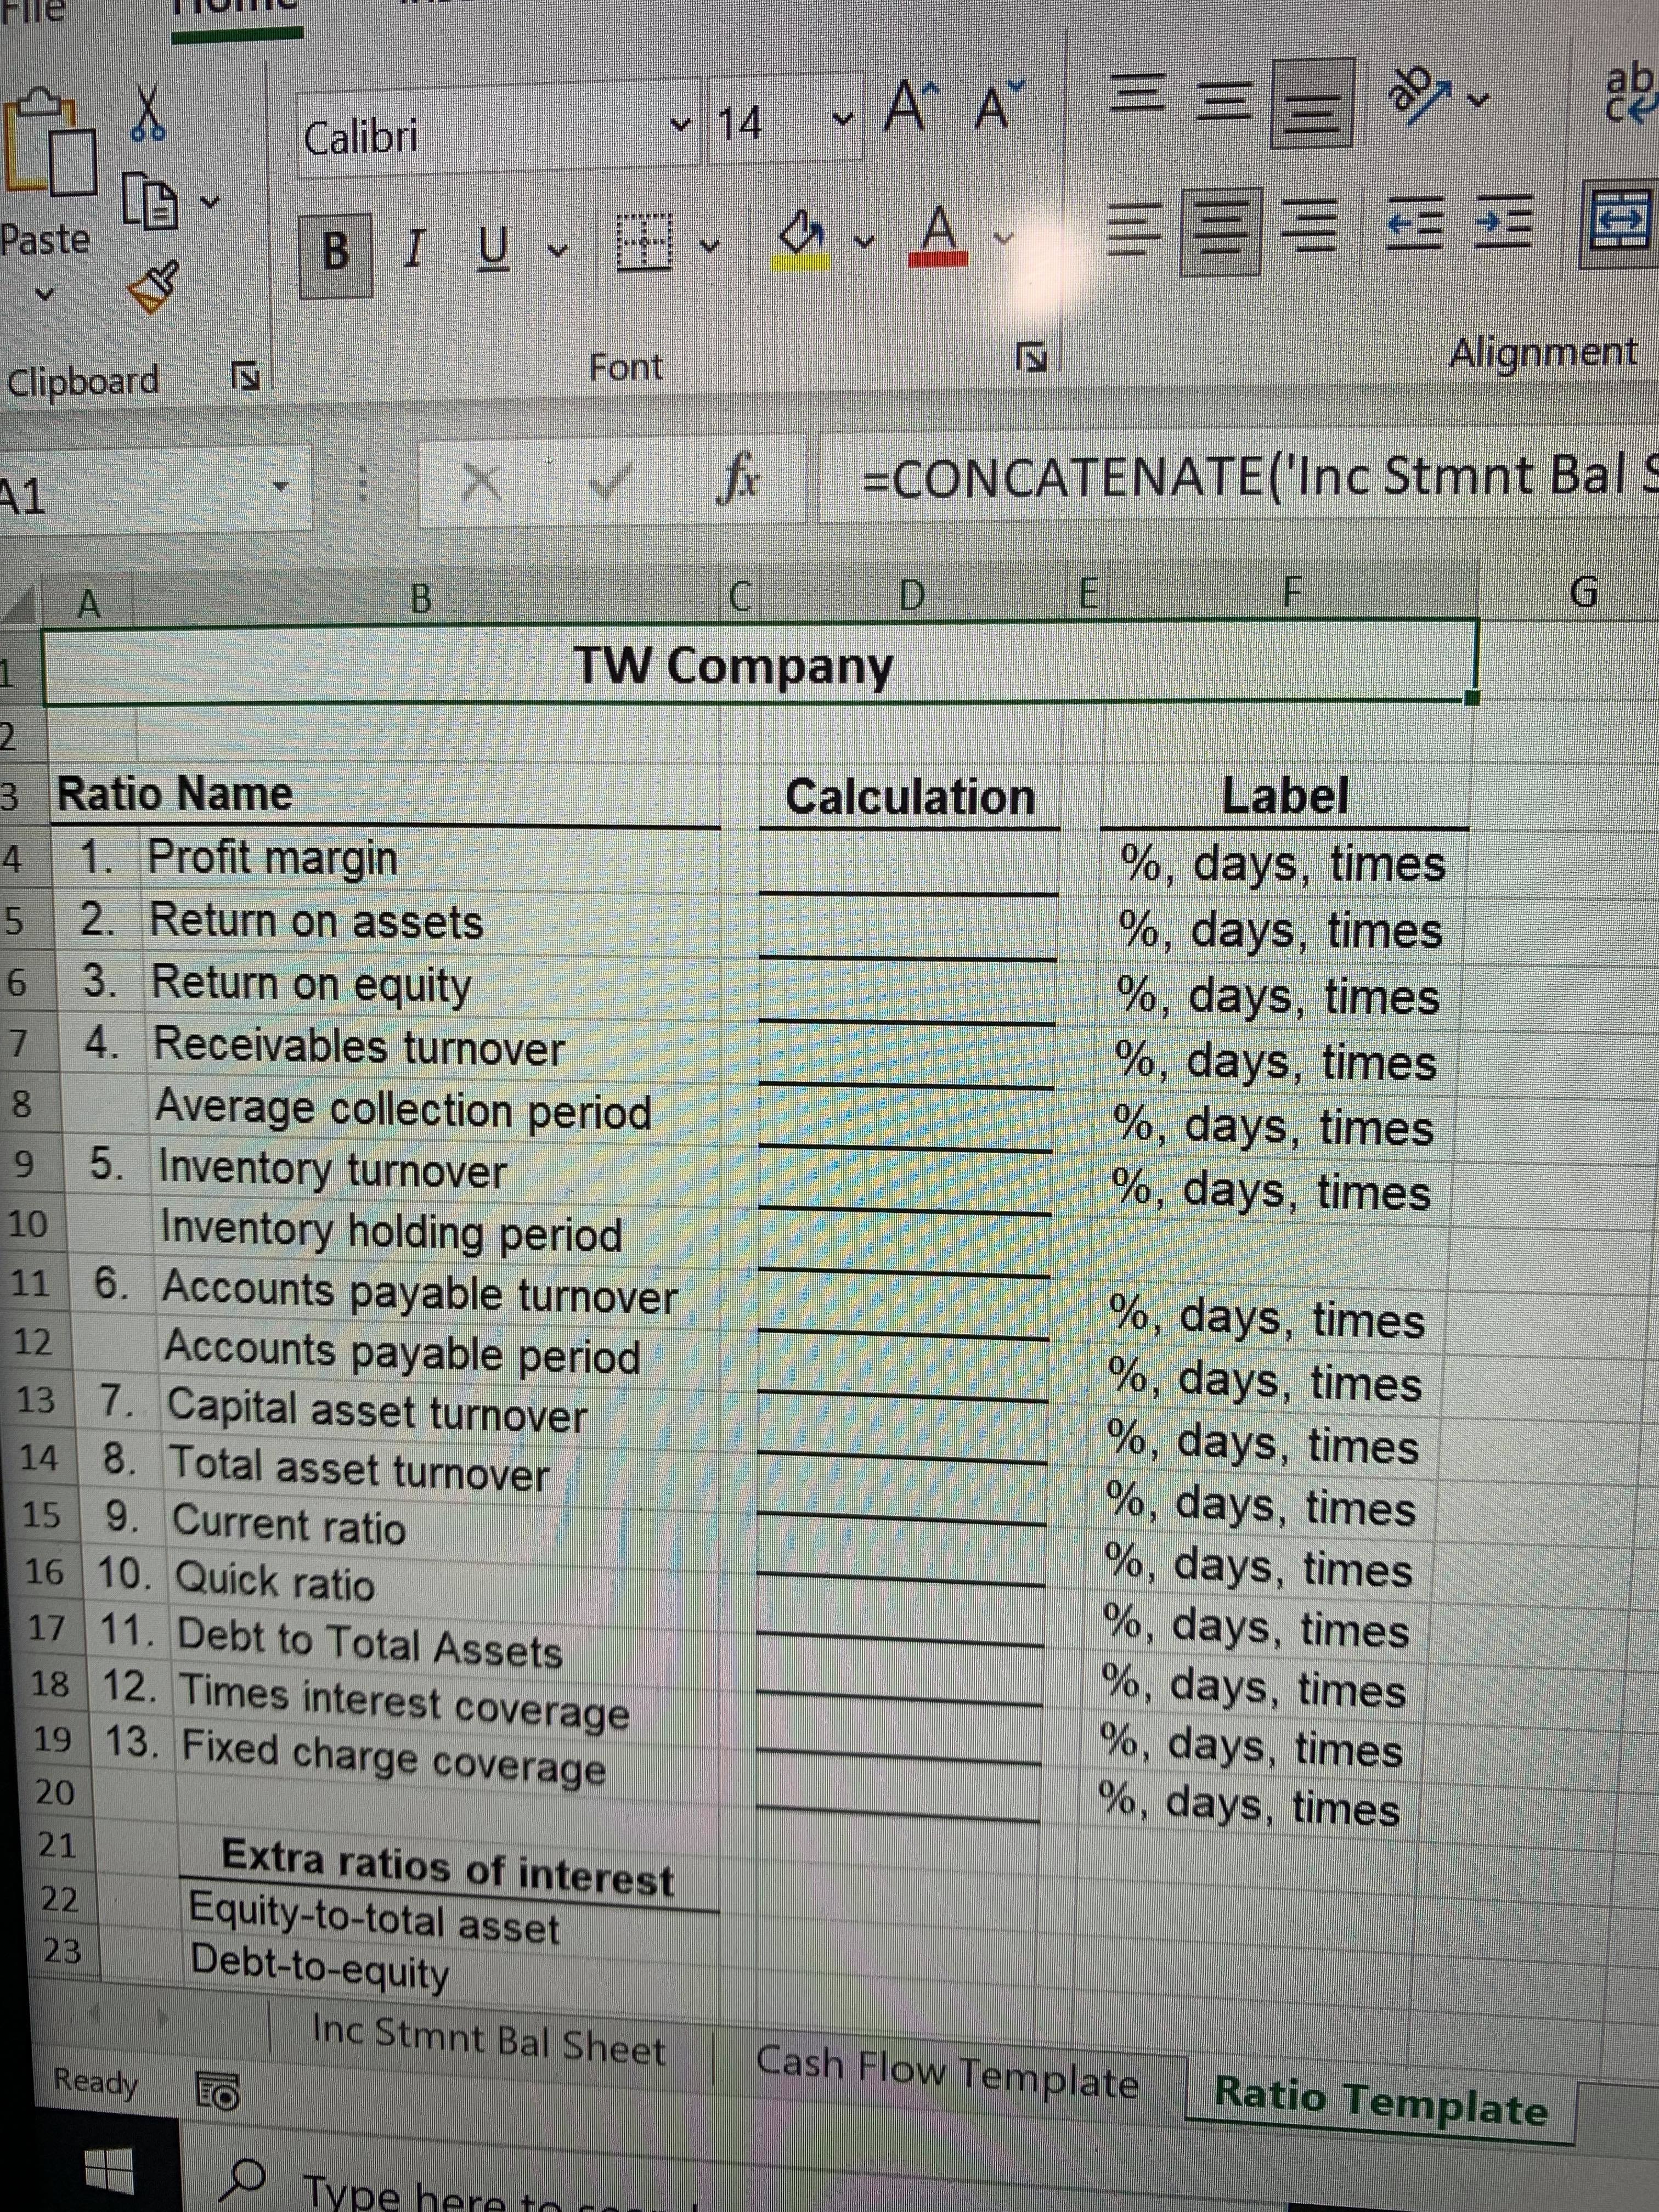
View Home Insert Draw Page Layout Formulas Data Review Dev File Arial v9 - AA Wrap Text General Paste BIU Merge & Center o Clipboard Font Alignment Nu A3 X V fx (All in millions, except per share data) A D E 1 Company TW 2 Fiscal Period 12/2020 12/2019 12/2018 3 (All in millions, except per share data) 4 Income Statement Items Sales 386,064 280,522 232,887 6 Cost of Goods Sold 233,307 165,536 139,156 7 Gross Profit 152,757 114,986 93,731 8 SG&A Expense 113, 185 84,529 68,401 9 EBITDA 39,572 30,457 25,330 10 Depreciation & Amortization 16,748 15 , 715 12,613 11 EBIT 22,824 14,742 12,717 12 Operating Income 22,824 14,742 12,717 13 Non-Op. Income (Expense) * 3,001 834 (39) 14 Interest Expense 1,647 1,600 1,417 15 Pretax Income 24, 178 13,976 11,261 16 Income Taxes 2,847 2,388 1, 188 17 Net Income 21,331 11,588 10,073 18 19 * includes a gain (loss) on sale of assets of 24,038 20 21 Common Shares Outstanding 503 498 491 25 26 Balance Sheet Items 27 Cash & Equivalents 84,653 55,342 28 Accounts Receivable 41,676 24,285 29 Inventories 20,495 12, 174 17, 174 30 Other Current Assets 20,497 17, 174 6,621 Inc Stmnt Bal Sheet 4.077 Cash Flow Template Ratio Template Ready LODraw Page Layout Formulas Data Review View Developer Arial ~ 9 AA de Wrap Text General Paste BI UV Merge & Center ~ $ ~ % 9 Clipboard Font Alignment IN Number A3 X - fx (All in millions, except per share data) A C D E K 1 Company TW 2 Fiscal Period 12/2020 12/2019 12/2018 31 Current Assets 132,733 96,334 75,101 32 PP&E - net 150,667 97 846 61,797 33 Other Long-term Investments 3,022 711 1,517 34 Other Assets 34,773 30,357 24,233 35 Total Assets 321,195 225,248 162,648 36 37 Short Term Debt 16, 115 14,330 9,502 38 Accounts Payable 72,539 47,183 38, 192 39 Other Current Liabilities 37,731 26,299 20,697 40 Current Liabilities 126,385 87,812 68,391 41 Long Term Debt 84,389 63,205 39,787 42 Other Long-term Obligations 17,017 12, 171 10,921 43 Total Liabilities 227,791 163, 188 119,099 44 45 Preferred Stock 46 Stockholder's Equity 93,404 62,060 43,549 47 Total Liabilities & Stockholder's Equity 321,195 225,248 162,648 48 19 Additional Information: 50 Fixed asset purchases in the year 40,140 16,861 51 Issued (repurchased) common stock in the amount of 52 Declared and paid dividends during the year of O 53 SG&A Expense includes fixed charges of: 4,527 3,381 54 80 Inc Stmnt Bal Sheet Cash Flow Template Ratio Template ReadyDraw Page Layout Formulas File Home Insert Arial ~ 12 ~ A" A LA Paste BIU B . CA. EE Clipboard Font A1 G A C D Statement of Cash Flow TW Company Statement of Cash Flows For the Period Ended 12/2020 (in Millions) Operating Activities 10 11 12 13 14 15 16 17 18 19 20 21 22 Cash provided by (used in) operating activities 23 24 Investing Activities 25 26 27 28 29 30 31 32 Cash used in investing activities 33 34 Financing Activities 85 36 27 Inc Stmnt Bal Sheet Cash Flow Tempile Home Insert Draw Page Layout Formulas Arial * 12 ~ A" A LA aste = = E lipboard Font Alig fx B C D G Cash provided by (used in) operating activities Investing Activities Cash used in investing activities Financing Activities Cash used in financing activities Net Increase (Decrease) in cash during the year Cash, beginning of year Cash, end of yearab Calibri Paste B I U - A Alignment Font Clipboard A1 fx =CONCATENATE('Inc Stmnt Bal C G 10 TW Company Ratio Name Calculation Label 4 1. Profit margin %, days, times 5 2. Return on assets %, days, times 6 3. Return on equity %, days, times 7 4. Receivables turnover %, days, times 8 Average collection period %, days, times 9 5. Inventory turnover %, days, times 10 Inventory holding period 11 6. Accounts payable turnover %, days, times 12 Accounts payable period %, days, times 13 7. Capital asset turnover %, days, times 14 8. Total asset turnover %, days, times 15 9. Current ratio %, days, times 16 10. Quick ratio %, days, times 17 11. Debt to Total Assets %, days, times 18 12. Times interest coverage 19 %, days, times 13. Fixed charge coverage 20 %, days, times 21 Extra ratios of interest 22 Equity-to-total asset 23 Debt-to-equity Inc Stmnt Bal Sheet Cash Flow Template Ready Ratio Template O Type her