

Question: View Policies Current Attempt in Progress Comparative data from the balance sheet of Sandhill Inc. are shown below. 2021 Current assets $118,000 2020 2019 $79,600
View Policies Current Attempt in Progress Comparative data from the balance sheet of Sandhill Inc. are shown below. 2021 Current assets $118,000 2020 2019 $79,600 $98,800 Non-current assets 383,000 333,500 284.000 Current liabilities 86,900 61,900 56,900 Non-current liabilities 144,000 122,300 149.000 Common shares 149.000 114,000 99.000 Retained earnings 121,100 114,900 77.900 Perform a horizontal percent of base year analysis using 2019 as the base year. (Round answers to 0 decimal places, e.s. 125%.) 2021 2020 2019 Current assets % Non-current assets % % Current liabilities % % Non-current liabilities % % % Common shares % % % Retained earnings % Calculate the horizontal percentage change for each year. (Round answers to O decimal places, eg 125%. Enter negative percent using either a negative sign preceding the number eg.-45 or parentheses eg. (45)) 2021 Current assets Non-current assets % Current liabilities % Non-current liabilities % Common shares % Retained earnings % 2020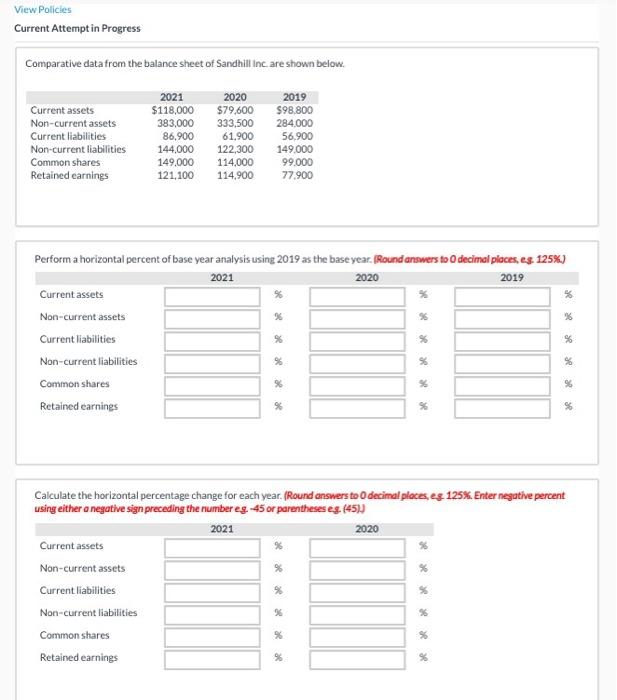
Step by Step Solution
There are 3 Steps involved in it

Get step-by-step solutions from verified subject matter experts