

Question: View Policies Current Attempt in Progress Comparative financial statement data for Loeb Corporation and Bowsh Corporation, two competitors, appear below. All balance sheet data are
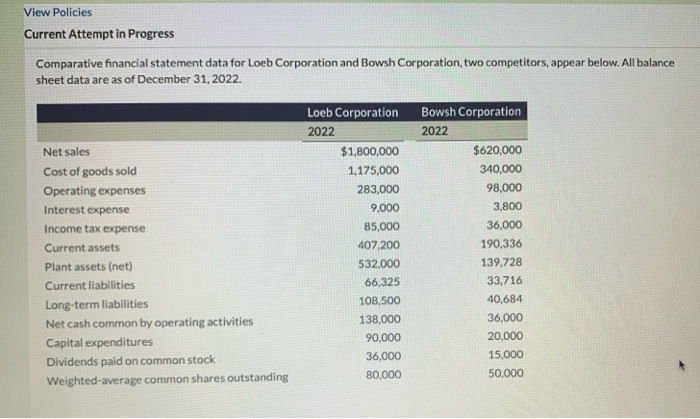
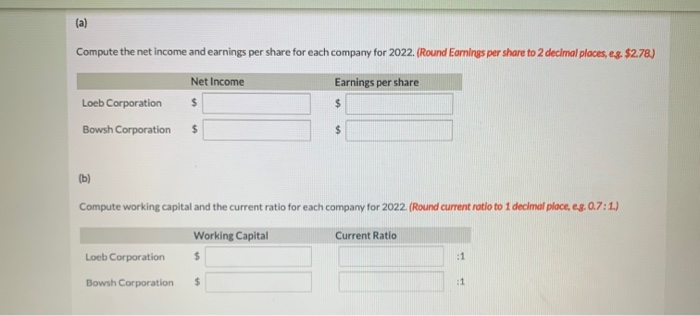
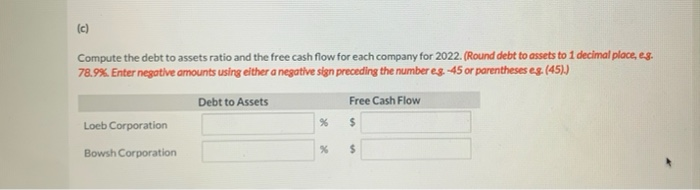
View Policies Current Attempt in Progress Comparative financial statement data for Loeb Corporation and Bowsh Corporation, two competitors, appear below. All balance sheet data are as of December 31, 2022. Net sales Cost of goods sold Operating expenses Interest expense Income tax expense Current assets Plant assets (net) Current liabilities Long-term liabilities Net cash common by operating activities Capital expenditures Dividends paid on common stock Weighted average common shares outstanding Loeb Corporation 2022 $1,800,000 1,175,000 283,000 9,000 85,000 407,200 532,000 66,325 108,500 138,000 90,000 36,000 80,000 Bowsh Corporation 2022 $620,000 340,000 98,000 3,800 36,000 190,336 139,728 33,716 40,684 36,000 20,000 15,000 50,000 (a) Compute the net income and earnings per share for each company for 2022. (Round Earnings per share to 2 decimal places, es $2.78.) Net Income Earnings per share Loeb Corporation $ Bowsh Corporation $ $ $ Compute working capital and the current ratio for each company for 2022. (Round current ratio to 1 decimal place, eg: 0.7: 1.) Working Capital Current Ratio Loeb Corporation $ :1 Bowsh Corporation $ :1 (c) Compute the debt to assets ratio and the free cash flow for each company for 2022. (Round debt to assets to 1 decimal place, es. 78.9%. Enter negative amounts using either a negative sign preceding the number eg.-45 or parentheses eg.(45)) Debt to Assets Free Cash Flow Loeb Corporation % $ % Bowsh Corporation $
Step by Step Solution
There are 3 Steps involved in it

Get step-by-step solutions from verified subject matter experts