

Question: View Policies Current Attempt in Progress Consider the data with analysis shown in the following computer output: Level N Mean StDev A 5 86.613 5.330

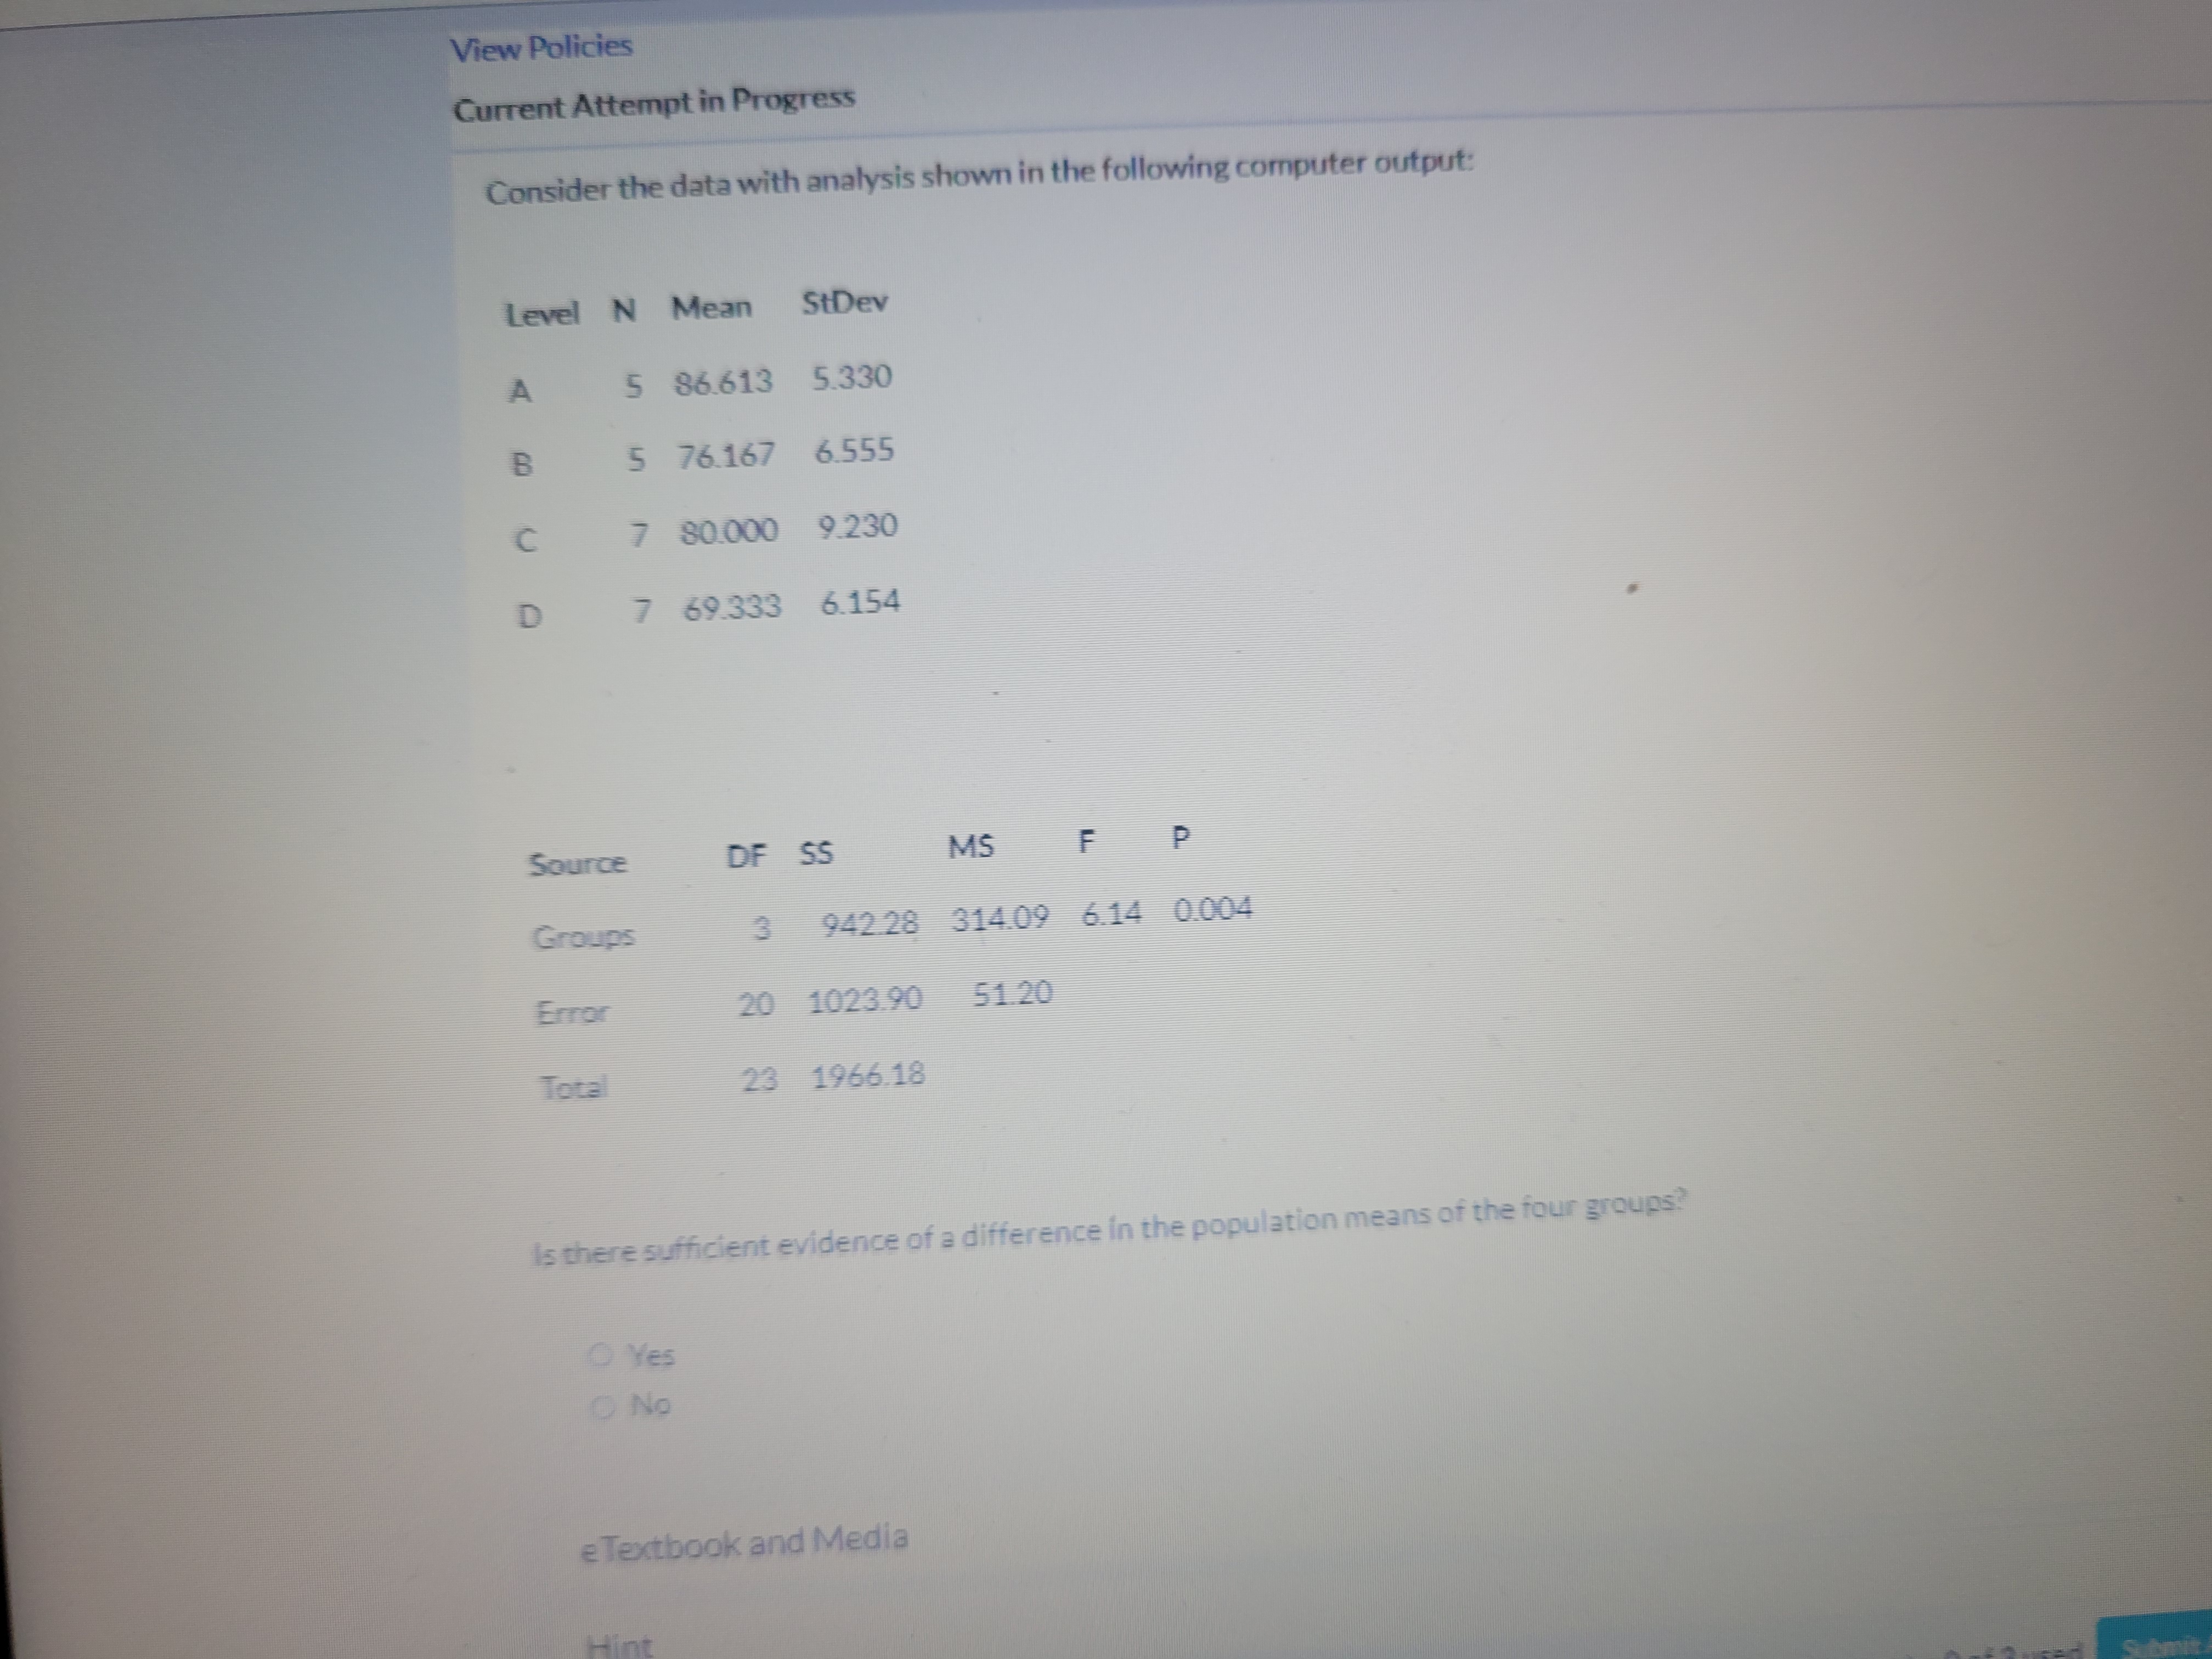
View Policies Current Attempt in Progress Consider the data with analysis shown in the following computer output: Level N Mean StDev A 5 86.613 5.330 B 5 76.167 6.555 C 7 80.000 9.230 D 7 69.333 6.154 Source OF SS MS F P Groups 3 942.28 314.09 6.14 0.004 Error 20 1023.90 51.20 Total 23 1966.18 Is there sufficient evidence of a difference in the population means of the four groups? Yes No e Textbook and Media
Step by Step Solution
There are 3 Steps involved in it
1 Expert Approved Answer
Step: 1 Unlock

Question Has Been Solved by an Expert!
Get step-by-step solutions from verified subject matter experts
Step: 2 Unlock
Step: 3 Unlock