

Question: View Policies Current Attempt in Progress Selected hypothetical financial data of Target and Wal-Mart for 2022 are presented here (in millions). Wal-Mart Target Corporation Stores,
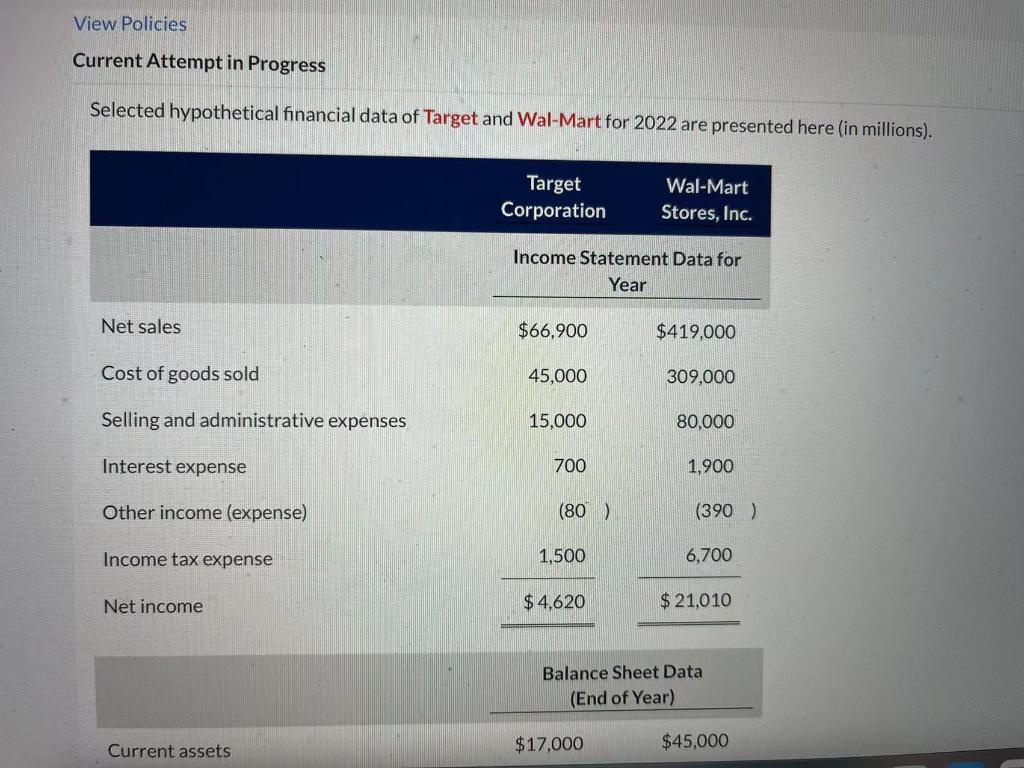
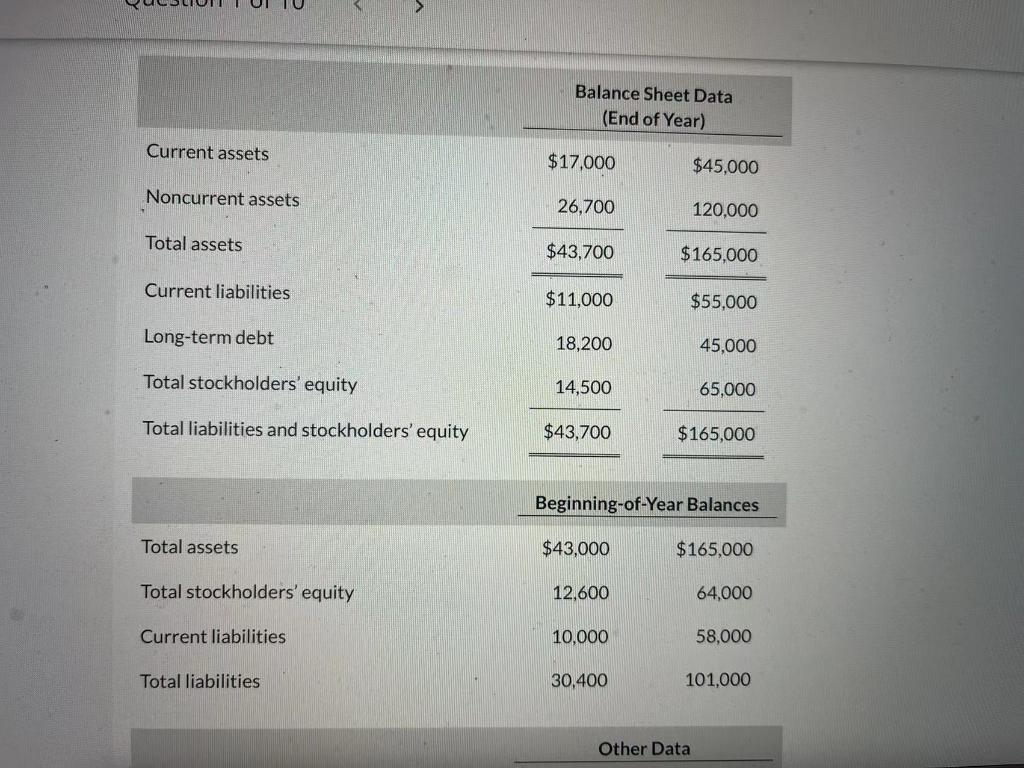
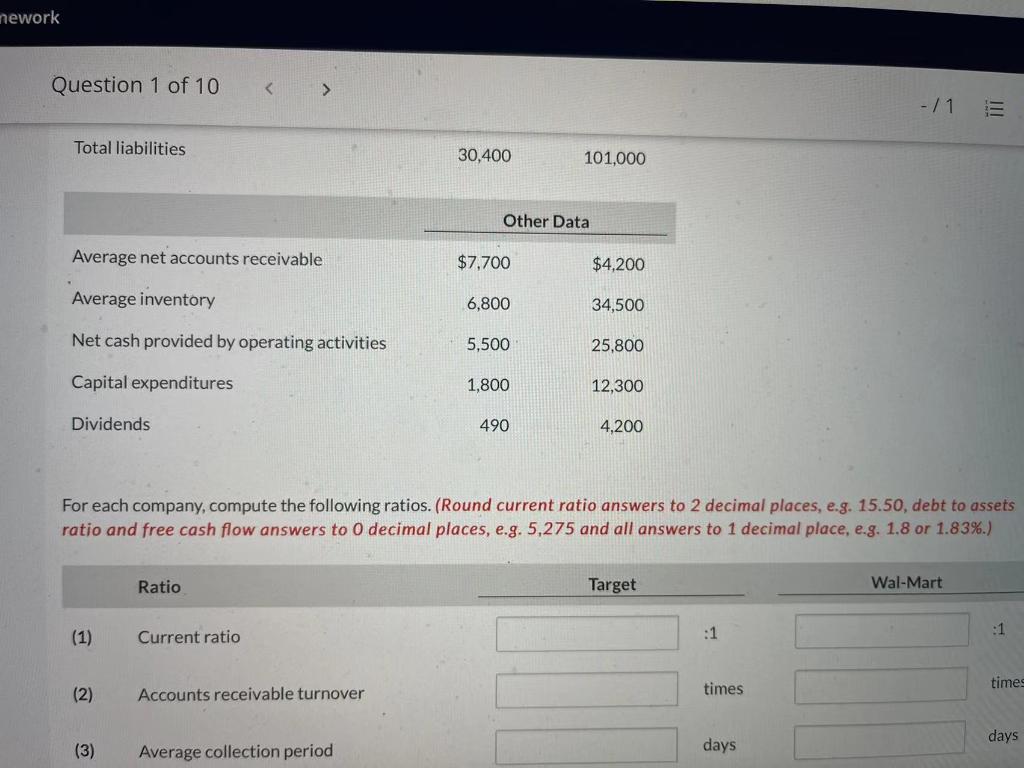
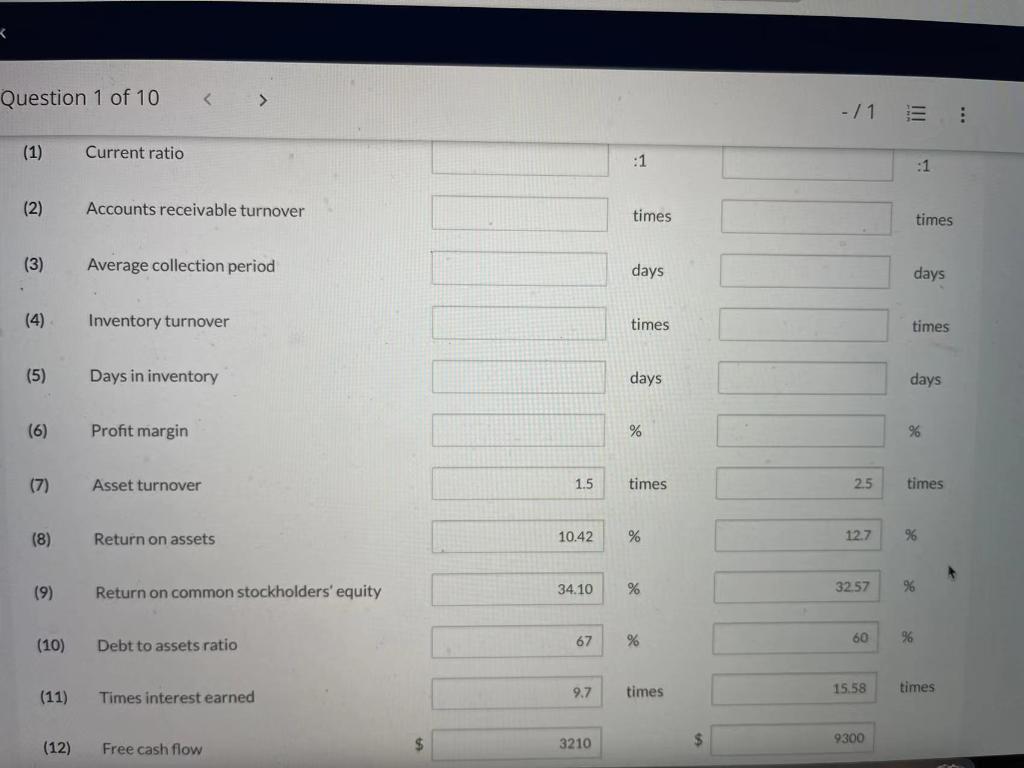
View Policies Current Attempt in Progress Selected hypothetical financial data of Target and Wal-Mart for 2022 are presented here (in millions). Wal-Mart Target Corporation Stores, Inc. Income Statement Data for Year Net sales $66,900 $419,000 Cost of goods sold 45,000 309,000 Selling and administrative expenses 15,000 80,000 Interest expense 700 1,900 Other income (expense) (80) (390) Income tax expense Net income Current assets 1,500 $4,620 6,700 $21,010 Balance Sheet Data (End of Year) $17,000 $45,000 Current assets Noncurrent assets Total assets Current liabilities Long-term debt Total stockholders' equity Total liabilities and stockholders' equity Total assets Total stockholders' equity Current liabilities Total liabilities Balance Sheet Data (End of Year) $17,000 $45,000 26,700 120,000 $43,700 $165,000 $11,000 $55,000 18,200 45,000 14,500 65,000 $43,700 $165,000 Beginning-of-Year Balances $43,000 $165,000 12,600 64,000 10,000 58,000 30,400 101,000 Other Data mework Question 1 of 10 > -/1 E Total liabilities 101,000 Average net accounts receivable $7,700 $4,200 Average inventory 6,800 34,500 Net cash provided by operating activities 5,500 25,800 Capital expenditures 1,800 12,300 Dividends 490 4,200 For each company, compute the following ratios. (Round current ratio answers to 2 decimal places, e.g. 15.50, debt to assets ratio and free cash flow answers to 0 decimal places, e.g. 5,275 and all answers to 1 decimal place, e.g. 1.8 or 1.83%.) Ratio Target Wal-Mart :1 :1 (1) Current ratio times times (2) Accounts receivable turnover days days (3) Average collection period 30,400 Other Data Question 1 of 10 (1) (2) (3) (4) (5) (6) (7) (8) (9) (10) (11) (12) > Current ratio Accounts receivable turnover Average collection period Inventory turnover Days in inventory Profit margin Asset turnover Return on assets Return on common stockholders' equity Debt to assets ratio Times interest earned Free cash flow $ 1.5. 10.42 34.10 67 9.7 3210 :1 times days times days % times % % % times $ -/1 2.5 12.7 32.57 60 15.58 9300 :1 times days times days % times % % % times
Step by Step Solution
There are 3 Steps involved in it

Get step-by-step solutions from verified subject matter experts