

Question: View Policies Current Attempt in Progress The following selected information in thousands) is available for Sheridan Inc.: Total assets Total liabilities Interest expense Income tax
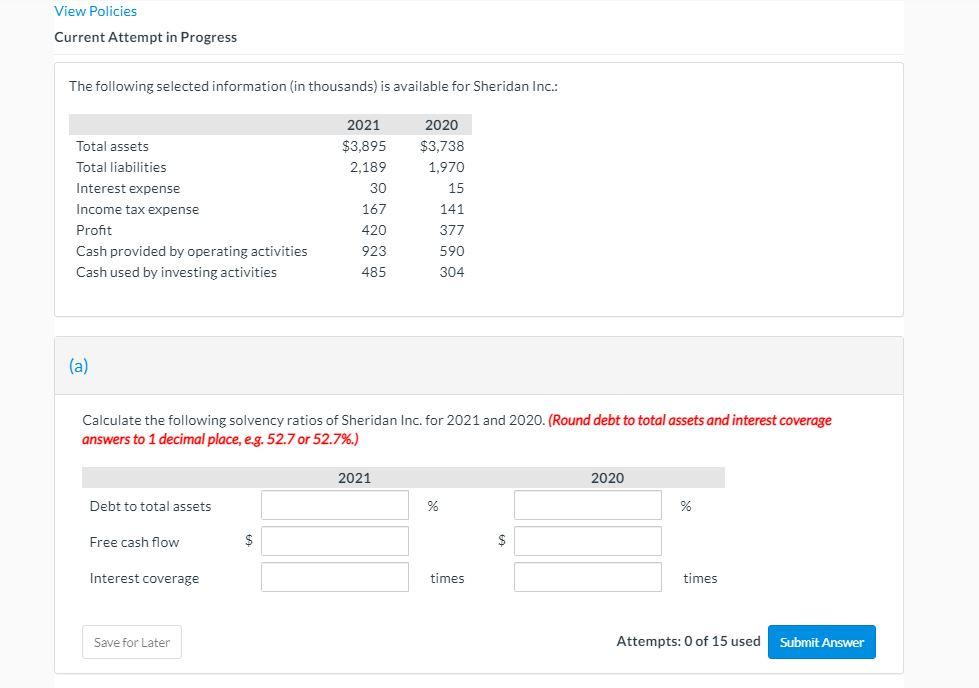
View Policies Current Attempt in Progress The following selected information in thousands) is available for Sheridan Inc.: Total assets Total liabilities Interest expense Income tax expense Profit Cash provided by operating activities Cash used by investing activities 2021 $3,895 2,189 30 167 420 923 485 2020 $3,738 1,970 15 141 377 590 304 (a) Calculate the following solvency ratios of Sheridan Inc. for 2021 and 2020. (Round debt to total assets and interest coverage answers to 1 decimal place, eg. 52.7 or 52.7%.) 2021 2020 Debt to total assets % % Free cash flow $ Interest coverage times times Save for Later Attempts: 0 of 15 used Submit
Step by Step Solution
There are 3 Steps involved in it

Get step-by-step solutions from verified subject matter experts