

Question: View the data presented in Table 4 . Questions 57 pertain to these data. 5. Table 4 presents data for net all-wave radiation (Q), expressed
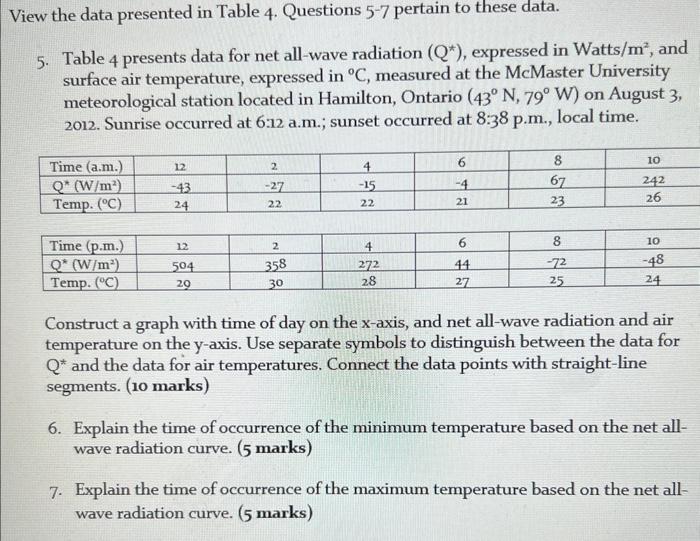
View the data presented in Table 4 . Questions 57 pertain to these data. 5. Table 4 presents data for net all-wave radiation (Q), expressed in Watts /m2, and surface air temperature, expressed in C, measured at the McMaster University meteorological station located in Hamilton, Ontario (43N,79W) on August 3 , 2012. Sunrise occurred at 6:12 a.m.; sunset occurred at 8:38 p.m., local time. Construct a graph with time of day on the x-axis, and net all-wave radiation and air temperature on the y-axis. Use separate symbols to distinguish between the data for Q and the data for air temperatures. Connect the data points with straight-line segments. (10 marks) 6. Explain the time of occurrence of the minimum temperature based on the net allwave radiation curve. ( 5 marks) 7. Explain the time of occurrence of the maximum temperature based on the net allwave radiation curve. ( 5 marks)
Step by Step Solution
There are 3 Steps involved in it

Get step-by-step solutions from verified subject matter experts