

Question: VII. At this point, you can complete the sentence by filling out the blank spaces with your thoughts about Bivariate and Scatterplots. A set of
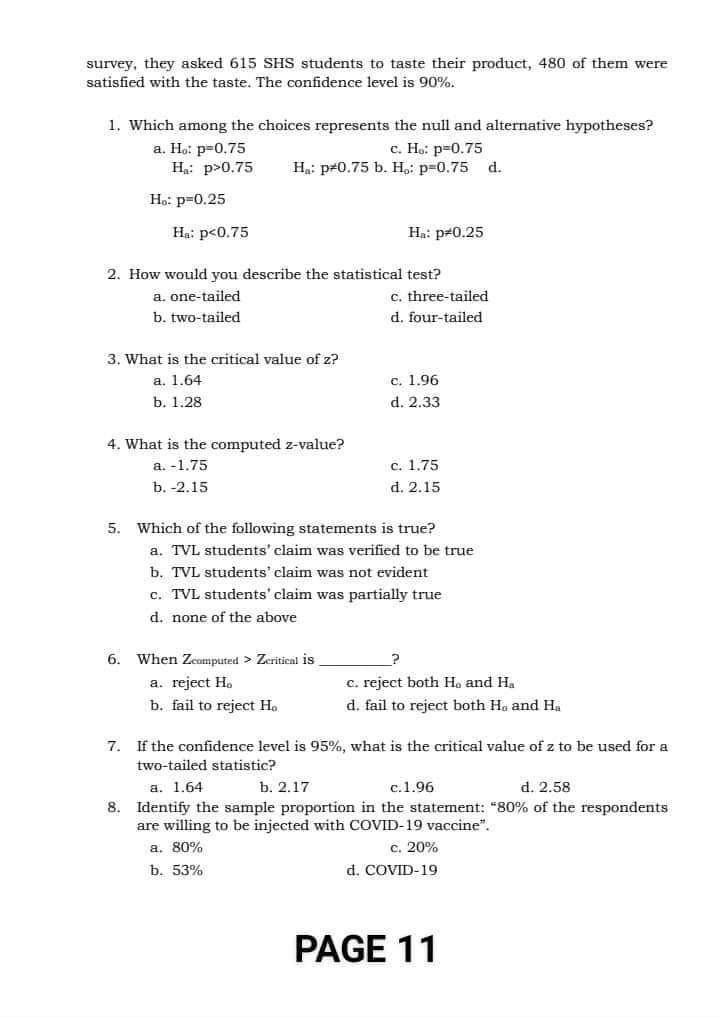

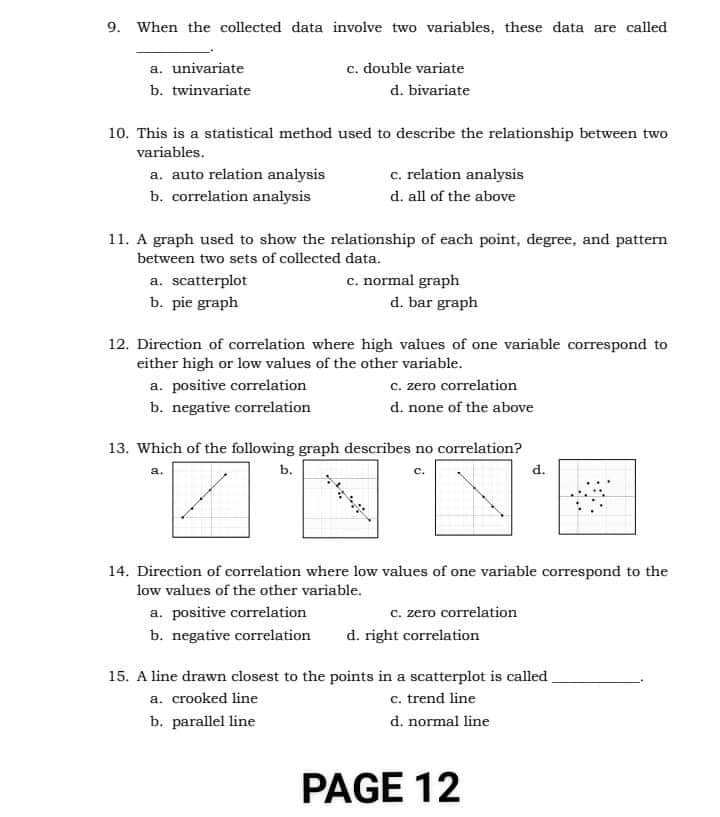
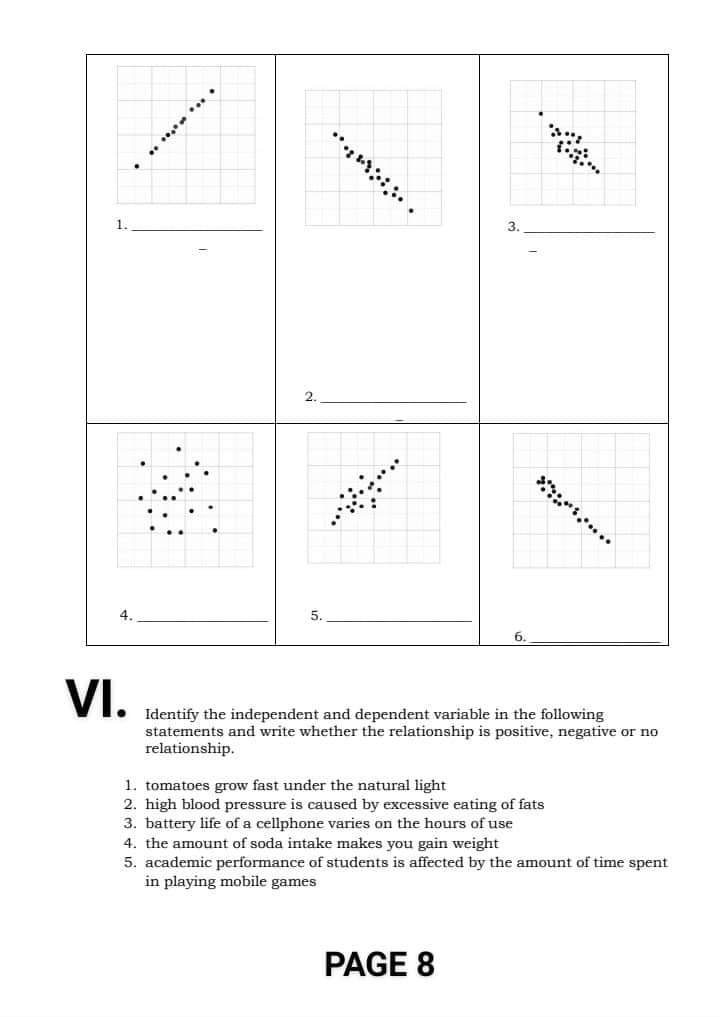


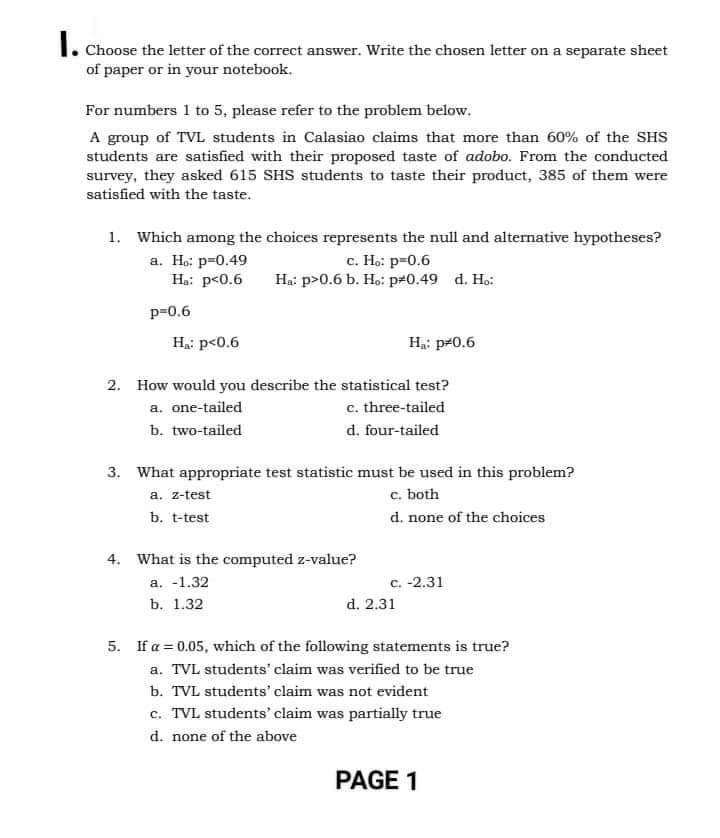
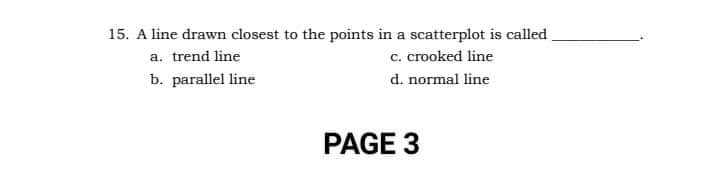
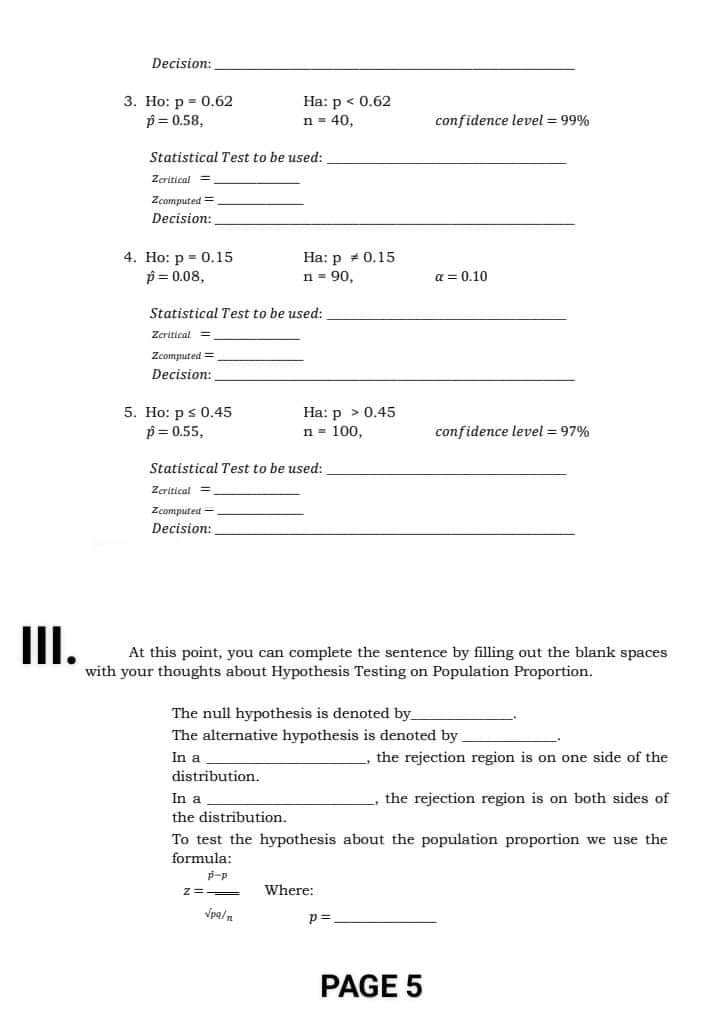


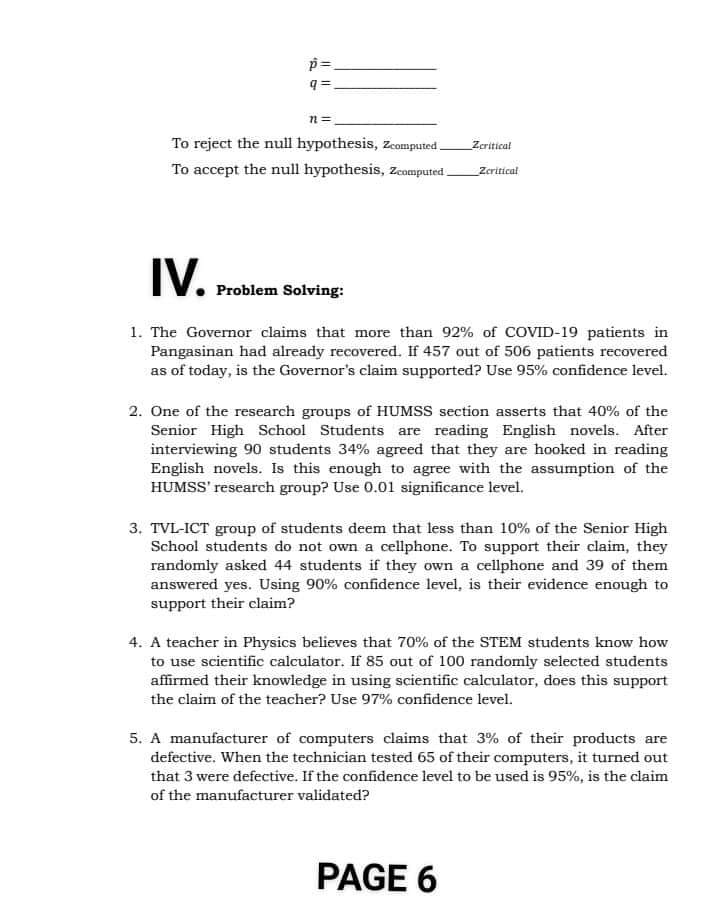


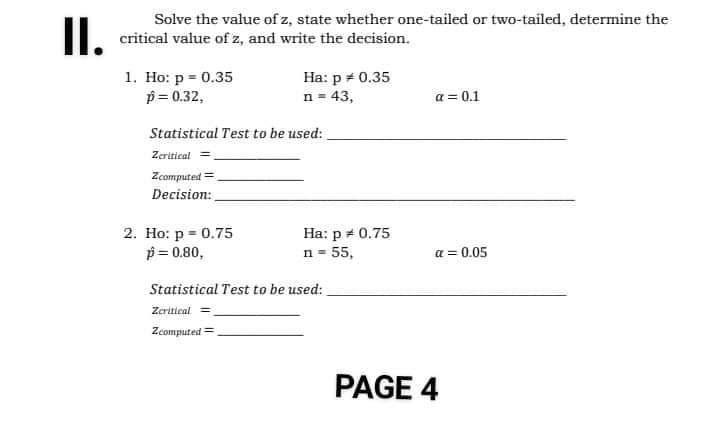
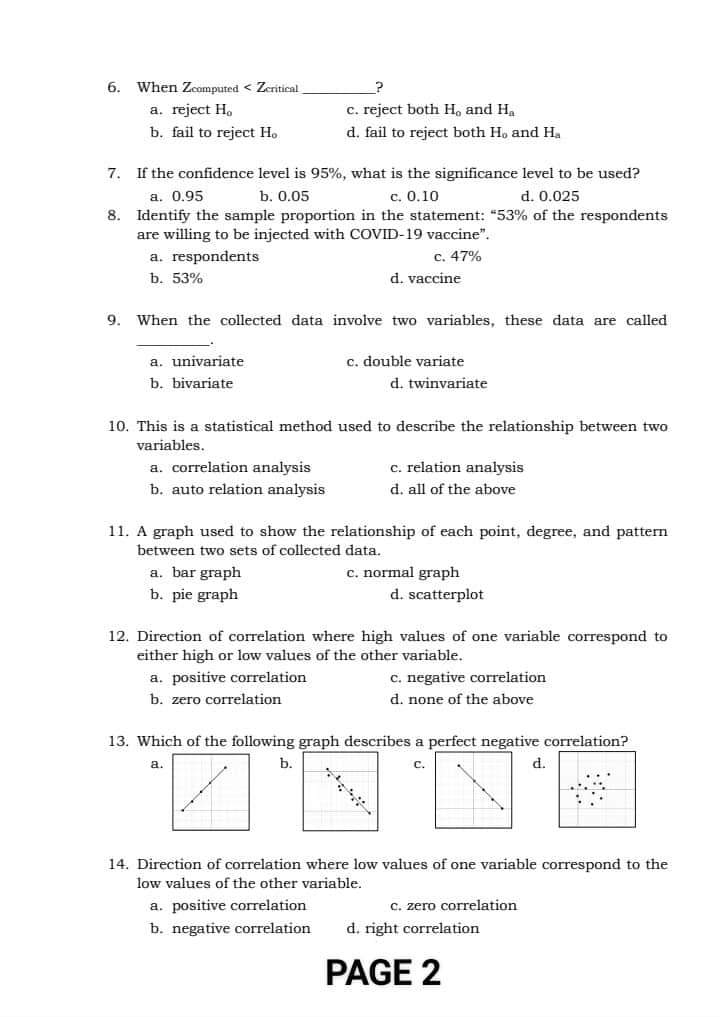


VII. At this point, you can complete the sentence by filling out the blank spaces with your thoughts about Bivariate and Scatterplots. A set of data that involve two variables is called The variable is basically the input data which causes the output or the variable to change. The trend line indicates the The direction of correlation can be and The of the correlation is indicated by the closeness of the points to the trendline. is a statistical method used to determine whether a relationship between two variables occurs. PAGE 9survey, they asked 615 SHS students to taste their product, 480 of them were satisfied with the taste. The confidence level is 90%. 1, Which among the choices represents the null and alternative hypotheses? a. Ho: p=0.75 C. Ho: p=0.75 Ha: p>0.75 Ha: p#0.75 b. H.: p=0.75 d. Ho: p=0.25 Ha: p Zcritical is a. reject Ho c. reject both H. and Ha b. fail to reject Ho d. fail to reject both Ho and Ha 7. If the confidence level is 95%, what is the critical value of z to be used for a two-tailed statistic? a. 1.64 b. 2.17 c. 1.96 d. 2.58 8. Identify the sample proportion in the statement: "80% of the respondents are willing to be injected with COVID-19 vaccine". a. 80% c. 20% b. 53% d. COVID-19 PAGE 11P= q = n = To reject the null hypothesis, Zcomputed- Zcritical To accept the null hypothesis, Zcomputed Zcritical IV. Problem Solving : 1. The Governor claims that more than 92% of COVID-19 patients in Pangasinan had already recovered. If 457 out of 506 patients recovered as of today, is the Governor's claim supported? Use 95% confidence level. 2. One of the research groups of HUMSS section asserts that 40% of the Senior High School Students are reading English novels. After interviewing 90 students 34% agreed that they are hooked in reading English novels. Is this enough to agree with the assumption of the HUMSS' research group? Use 0.01 significance level. 3. TVL-ICT group of students deem that less than 10% of the Senior High School students do not own a cellphone. To support their claim, they randomly asked 44 students if they own a cellphone and 39 of them answered yes. Using 90% confidence level, is their evidence enough to support their claim? 4. A teacher in Physics believes that 70% of the STEM students know how to use scientific calculator. If 85 out of 100 randomly selected students affirmed their knowledge in using scientific calculator, does this support the claim of the teacher? Use 97% confidence level. 5. A manufacturer of computers claims that 3% of their products are defective. When the technician tested 65 of their computers, it turned out that 3 were defective. If the confidence level to be used is 95%, is the claim of the manufacturer validated? PAGE 6V. Draw the trend line and give the characteristics of the bivariate data. PAGE 79. When the collected data involve two variables, these data are called a. univariate c. double variate b. twinvariate d. bivariate 10. This is a statistical method used to describe the relationship between two variables. a. auto relation analysis c. relation analysis b. correlation analysis d. all of the above 11. A graph used to show the relationship of each point, degree, and pattern between two sets of collected data. a. scatterplot c. normal graph b. pie graph d. bar graph 12. Direction of correlation where high values of one variable correspond to either high or low values of the other variable. a. positive correlation c. zero correlation b. negative correlation d. none of the above 13, Which of the following graph describes no correlation? b. d. 14. Direction of correlation where low values of one variable correspond to the low values of the other variable. a. positive correlation c. zero correlation b. negative correlation d. right correlation 15. A line drawn closest to the points in a scatterplot is called a. crooked line c. trend line b. parallel line d. normal line PAGE 12X. Answer each question by collecting data from your home or neighbors. Collect at least 10 data and construct the scatterplot. 1. Is there a relationship between the size of a waistline and weight of a person? 2. Is there a relationship between the size of the feet and height of a person? 3. Cut 10 triangles with different size. Measure the base and the perimeter. Is there a relationship between the base and the perimeter of a triangle? PAGE 13.. ..... ..# 1. 3. 2. 4 . 5. 6. VI. Identify the independent and dependent variable in the following statements and write whether the relationship is positive, negative or no relationship. 1. tomatoes grow fast under the natural light 2. high blood pressure is caused by excessive eating of fats 3. battery life of a cellphone varies on the hours of use 4. the amount of soda intake makes you gain weight 5. academic performance of students is affected by the amount of time spent in playing mobile games PAGE 8II. Solve the value of z, state whether one-tailed or two-tailed, determine the critical value of z, and write the decision. 1. Ho: p = 0.35 Ha: p = 0.35 p = 0.32, n = 43, a =0.1 Statistical Test to be used: Zcritical = Z computed = Decision: 2. Ho: p = 0.75 Ha: p = 0.75 p = 0.80, n - 55, a = 0.05 Statistical Test to be used: Z computed = PAGE 46. When Zcomputed
Step by Step Solution
There are 3 Steps involved in it

Get step-by-step solutions from verified subject matter experts