

Question: VILI 73 Problem #1: Write a MATLAB script named assignment 3plxyz.m (replace xyz with your initials) to generate the plot of the following function f(t)
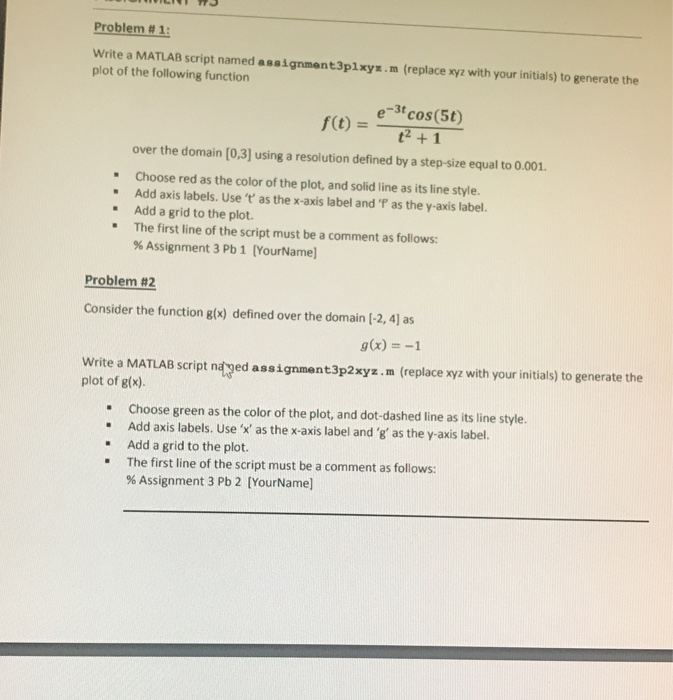
VILI 73 Problem #1: Write a MATLAB script named assignment 3plxyz.m (replace xyz with your initials) to generate the plot of the following function f(t) = e cos(56) 1 +1 over the domain (0,3] using a resolution defined by a step-size equal to 0.001. Choose red as the color of the plot, and solid line as its line style. Add axis labels. Use 't' as the x-axis label and 'Pas the y-axis label. Add a grid to the plot. The first line of the script must be a comment as follows: % Assignment 3 Pb 1 [Your Name] - Problem #2 Consider the function g(x) defined over the domain (-2, 4) as g(x) = -1 Write a MATLAB script nayed assignment3p2xyz.m (replace xyz with your initials) to generate the plot of g(x). Choose green as the color of the plot, and dot-dashed line as its line style. Add axis labels. Use 'x' as the x-axis label and 'g' as the y-axis label. Add a grid to the plot. The first line of the script must be a comment as follows: % Assignment 3 Pb 2 [Your Name]
Step by Step Solution
There are 3 Steps involved in it

Get step-by-step solutions from verified subject matter experts