

Question: VISUAL BASIC PROGRAMMING: Program 2. Population 2 You are to use the same information as provided for Question 1. However, this time you are to
VISUAL BASIC PROGRAMMING: Program 2. Population 2
You are to use the same information as provided for Question 1. However, this time you are to output one row for each year, and the row should show the year, the population of China, and the population of India. Limit the population values to 6 decimal places. Make sure you have entered the titles correctly. Use a ListBox for the output. Information on ListBoxes starts on page 311 of the textbook (version 7). You will need to use the Items.Add method.
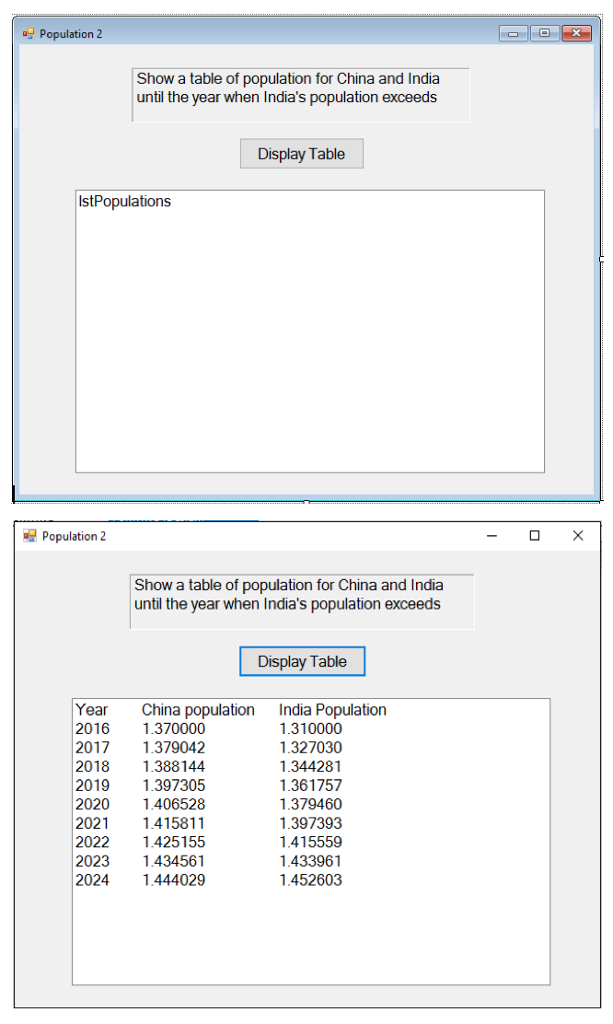
Population 2 Show a table of population for China and India until the year when India's population exceeds Display Table IstPopulations Population 2 Show a table of population for China and India until the year when India's population exceeds Display Table Year China population India Population 2016 1.370000 2017 1.379042 20181.388144 20191397305 2020 1.406528 2021 1.415811 2022 1.425155 2023 1.434561 20241.444029 1.310000 1.327030 1.344281 1.361757 1.379460 1.397393 1.415559 1.433961 1.452603
Step by Step Solution
There are 3 Steps involved in it

Get step-by-step solutions from verified subject matter experts