

Question: W 2 . Using the data obtained in Step P 5 ( frequency versus F ) , calculate the wave speed for each case by
W Using the data obtained in Step Pfrequency versus calculate the wave speed for each case by multiplying the frequency by Explain why we use and not Using Excel, superimpose plots of versus and versus you must add a secondary axis to properly display both sets of data The horizontal scale and points will be the same in both cases, but the axes will have two scales one for and another for Using Excel, add a linear "Trendline" to both sets of data. Can you conclude from looking at this graph whether your data is closer to obeying
where a and are constants of proportionality. Suppose you thought the theoretical relationship between the tension and the resultant wave speed might indicate an equation of the form where is another constant of proportionality? What quantities would you plot in order to test this hint: you would like to find a straight line What quantities would you plot to test whether is a valid formula or not, where is yet another constant of proportionality? Explain your reasoning.
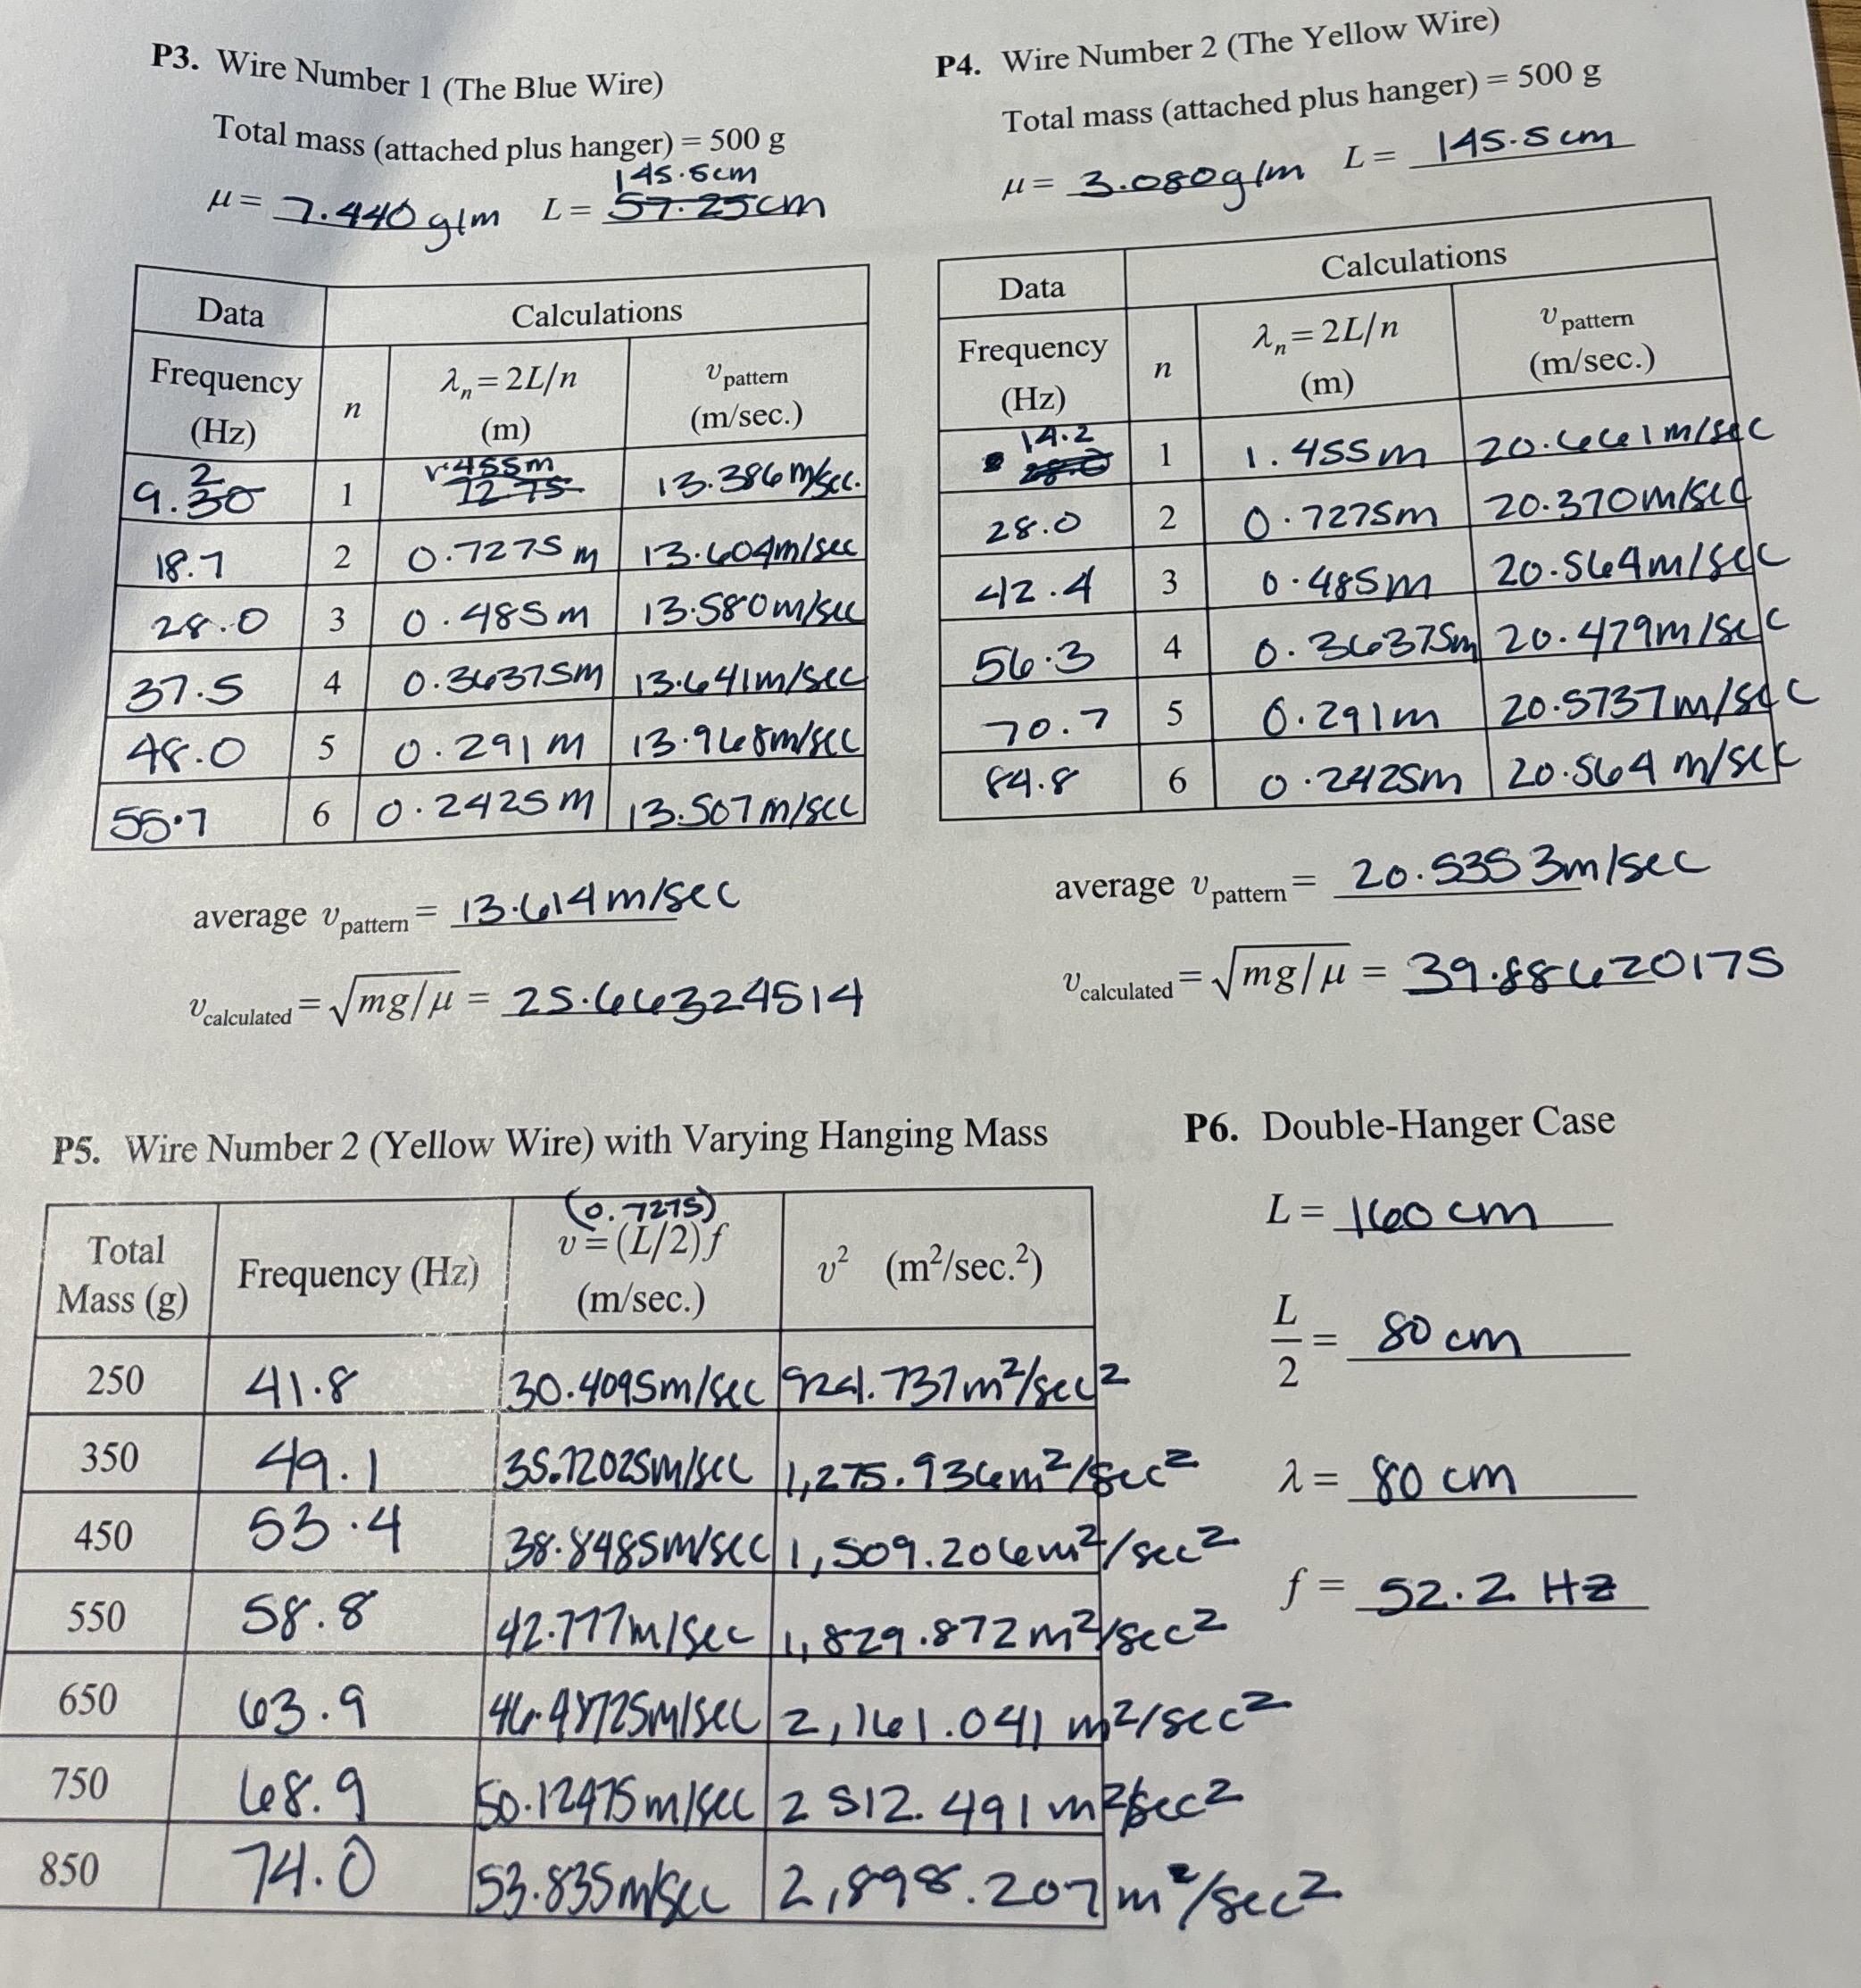
P Wire Number The Blue Wire
Total mass attached plus hanger
average
P Wire Number The Yellow Wire Total mass attached plus hanger
average
P Wire Number Yellow Wire with Varying Hanging Mass
Step by Step Solution
There are 3 Steps involved in it
1 Expert Approved Answer
Step: 1 Unlock

Question Has Been Solved by an Expert!
Get step-by-step solutions from verified subject matter experts
Step: 2 Unlock
Step: 3 Unlock