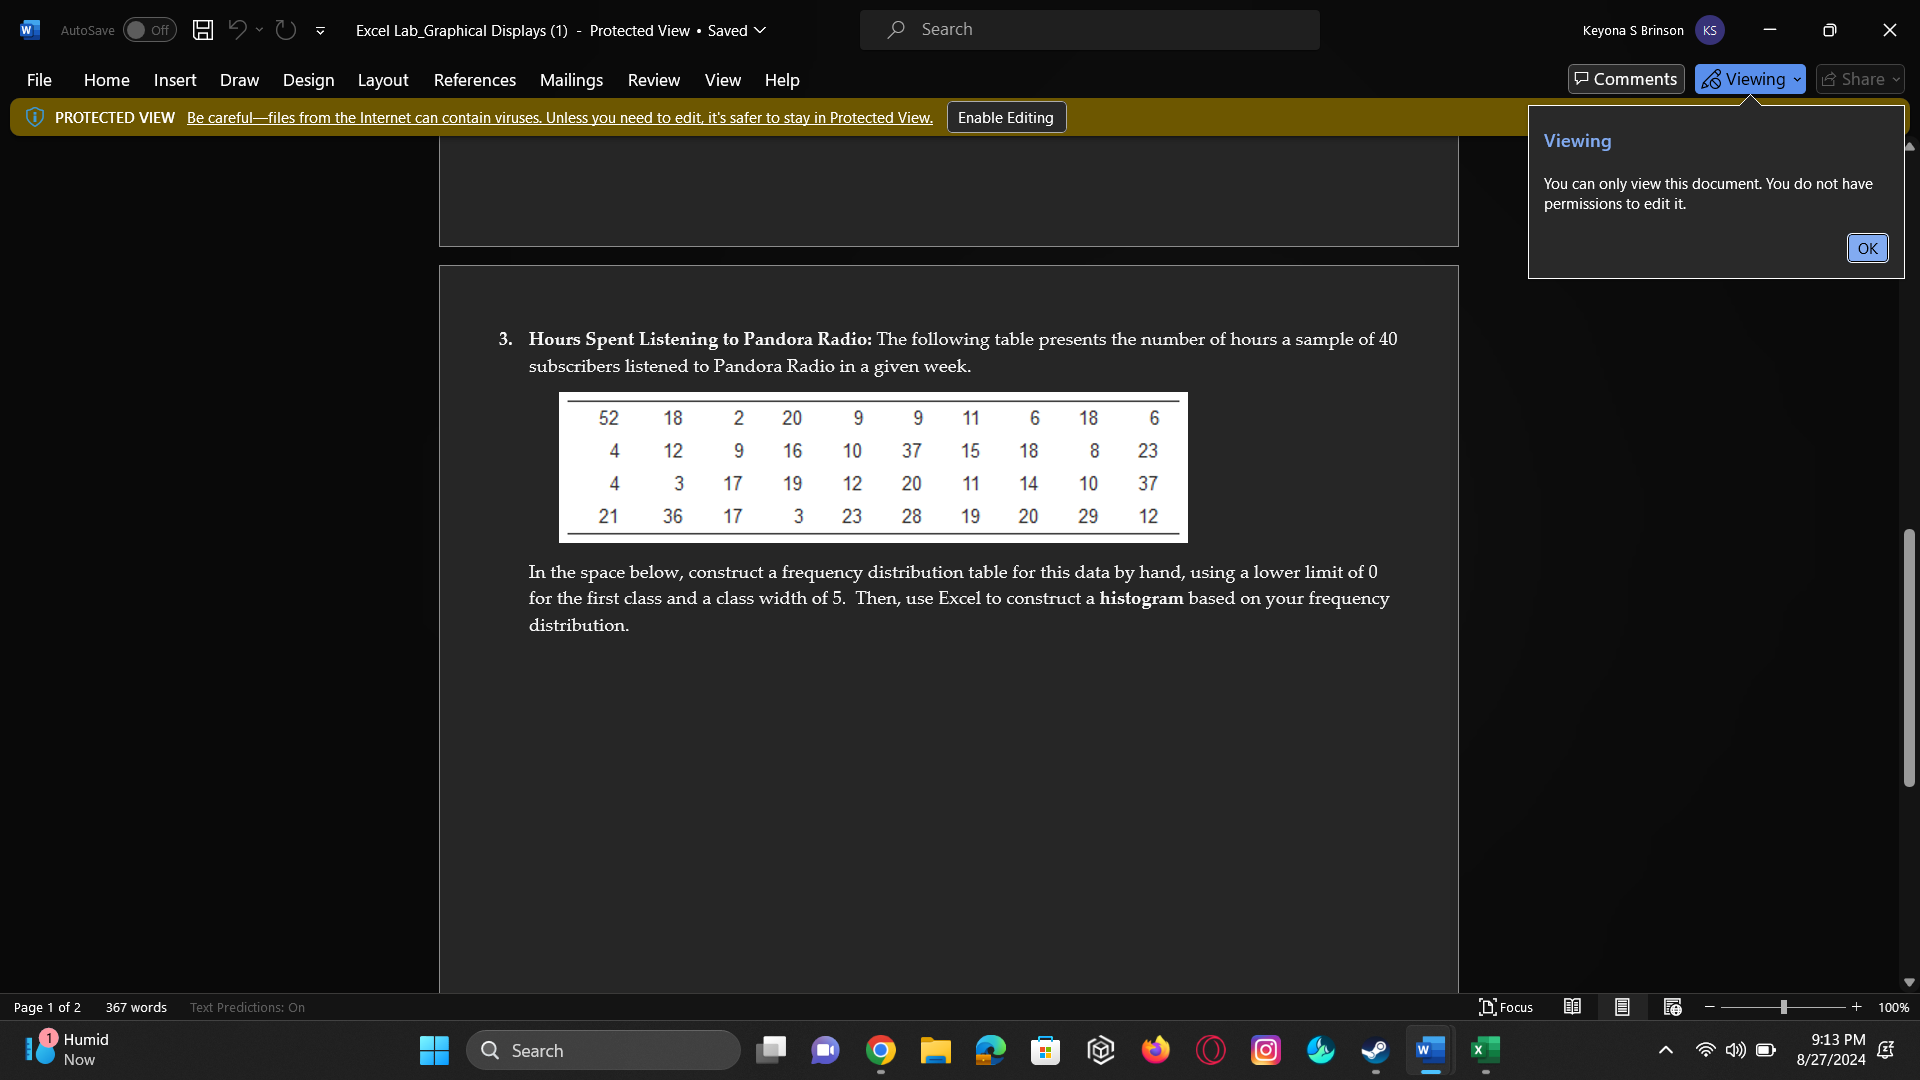
Question: W AutoSave Off Excel Lab_Graphical Displays (1) - Protected View . Saved v O Search Keyona S Brinson KS File Home Insert Draw Design Layout

W AutoSave Off Excel Lab_Graphical Displays (1) -
W AutoSave Off Excel Lab_Graphical Displays (1) - Protected View . Saved v O Search Keyona S Brinson KS File Home Insert Draw Design Layout References Mailings Review View Help Comments LO Viewing Share PROTECTED VIEW Be careful-files from the Internet can contain viruses. Unless you need to edit, it's safer to stay in Protected View. Enable Editing Viewing You can only view this document. You do not have permissions to edit it. OK 3. Hours Spent Listening to Pandora Radio: The following table presents the number of hours a sample of 40 subscribers listened to Pandora Radio in a given week 52 18 2 20 9 9 11 6 18 6 4 12 9 16 10 37 15 18 8 23 4 17 19 12 20 11 14 10 37 21 36 17 3 23 28 19 20 29 12 In the space below, construct a frequency distribution table for this data by hand, using a lower limit of 0 for the first class and a class width of 5. Then, use Excel to construct a histogram based on your frequency distribution. Page 1 of 2 367 words Text Predictions: On Focus 100% 1 Humid 9:13 PM Q Search W Now 8/27/2024

Step by Step Solution

There are 3 Steps involved in it

1 Expert Approved Answer
Step: 1 Unlock blur-text-image
Question Has Been Solved by an Expert!

Get step-by-step solutions from verified subject matter experts

Step: 2 Unlock
Step: 3 Unlock

Students Have Also Explored These Related Mathematics Questions!