Question: w AutoSeve On C EMGT 615 Homework 3 Problems chapter 7 - Last Modified: Sun at 534 AM - Search (Alt+Q) Gopi Shaik 1 File
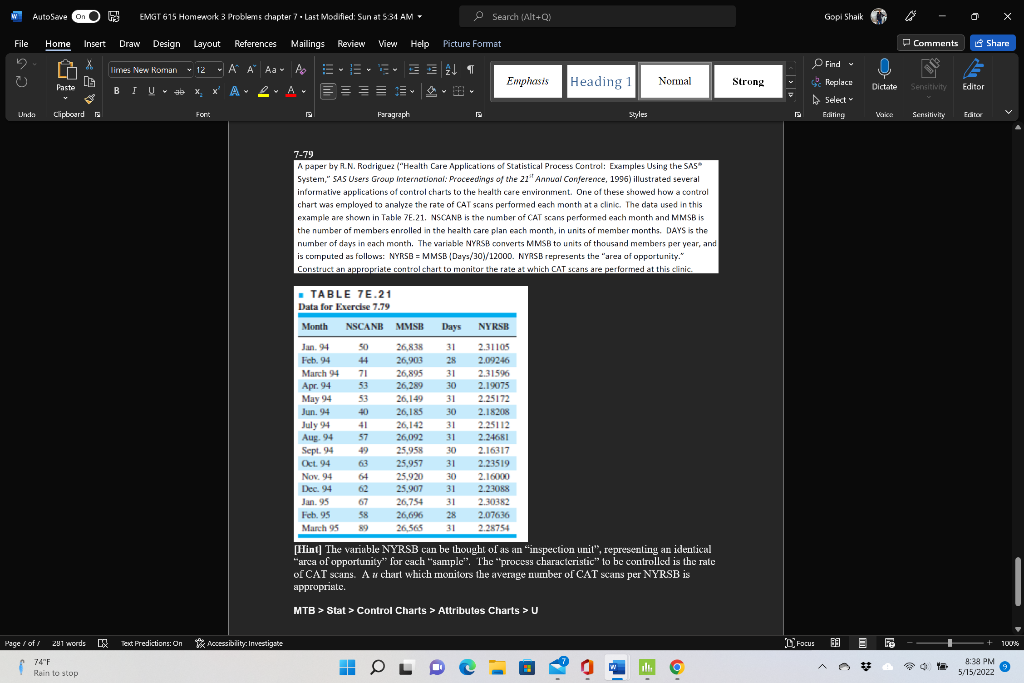
w AutoSeve On C EMGT 615 Homework 3 Problems chapter 7 - Last Modified: Sun at 534 AM - Search (Alt+Q) Gopi Shaik 1 File Home Insert Draw Design Layout References Mailings Review View Help Picture Format Comments Share X LG Find - A A Times New Roman v 12 Aa. A == == : yyy Emphasis Heading 1 Normal Strong Paste BIU36 X 2 A Dictate Sensitivity Editor Replacu Select Editing Undo Clipboard Fort E Paragraph Styles Kalce Sensitivity Editor 7-79 A paper by R. N. Rodriguez ("Health Care Applications of Statistical Process Control: Examples Using the SAS System," SAS Users Group International: Proceedings of the 21st Annual Conference, 1996) illustrated several informative applications of control charts to the health care environment. One of these showed how a control chart was employed to analyze the rate of CAT scans performed each month at a clinic. The data used in this example are shown in Table 7.21. NSCANB is the number of CAT scans performed each month and MMSB is the number of members enrolled in the health care plan each month, in units of member months. DAYS is the number of days in each month. The variable NYRSB converts MMSB to units of thousand members per year, and is computed as follows: NYRSB = MMSB (Days/30)/12000. NYRSB represents the area of opportunity." Construct an appropriate control chart to monitor the rate at which CAT scans are performed at this clinic. TABLE 7E.21 Data for Exercise 7.79 Month NSCANB MMSB Days NYRSB Jan. 94 Feb. 94 March 94 Apr. 94 May 94 Jun. 94 July 94 Aug. 94 Sept. 94 Oct. 94 Nov. 94 Dec. 94 Jan. 95 Feb. 95 March 9 50 44 71 53 53 40 41 57 49 63 64 62 26,838 26,903 26,895 26,289 26,149 26,185 26,142 26,092 25.958 25,957 25.920 25,907 26,754 26,696 26.565 31 28 31 30 31 30 31 31 30 31 30 31 31 28 31 2.31105 2.09246 2.31596 2.19075 2.25172 2.18208 2.25112 2.24681 2.16317 2.23519 2.16000 2.23088 2.30382 2.07636 2.28754 58 89 [Hint] The variable NYRSB can be thought of as an inspection unit", representing an identical "arca of opportunity" for cach sample". The process characteristic" to bc controlled is the rate of CAT scans. A chart which monitors the average number of CAT scans per NYRSB is appropriate MTB > Stat > Control Charts > Attributes Charts >U Page 1 of 291 words X Text Predictions: On Accessibility: Investigate Focus 30 + 100% % 74"F Rain to stop 8:38 PM 9 5/15/2022 w AutoSeve On C EMGT 615 Homework 3 Problems chapter 7 - Last Modified: Sun at 534 AM - Search (Alt+Q) Gopi Shaik 1 File Home Insert Draw Design Layout References Mailings Review View Help Picture Format Comments Share X LG Find - A A Times New Roman v 12 Aa. A == == : yyy Emphasis Heading 1 Normal Strong Paste BIU36 X 2 A Dictate Sensitivity Editor Replacu Select Editing Undo Clipboard Fort E Paragraph Styles Kalce Sensitivity Editor 7-79 A paper by R. N. Rodriguez ("Health Care Applications of Statistical Process Control: Examples Using the SAS System," SAS Users Group International: Proceedings of the 21st Annual Conference, 1996) illustrated several informative applications of control charts to the health care environment. One of these showed how a control chart was employed to analyze the rate of CAT scans performed each month at a clinic. The data used in this example are shown in Table 7.21. NSCANB is the number of CAT scans performed each month and MMSB is the number of members enrolled in the health care plan each month, in units of member months. DAYS is the number of days in each month. The variable NYRSB converts MMSB to units of thousand members per year, and is computed as follows: NYRSB = MMSB (Days/30)/12000. NYRSB represents the area of opportunity." Construct an appropriate control chart to monitor the rate at which CAT scans are performed at this clinic. TABLE 7E.21 Data for Exercise 7.79 Month NSCANB MMSB Days NYRSB Jan. 94 Feb. 94 March 94 Apr. 94 May 94 Jun. 94 July 94 Aug. 94 Sept. 94 Oct. 94 Nov. 94 Dec. 94 Jan. 95 Feb. 95 March 9 50 44 71 53 53 40 41 57 49 63 64 62 26,838 26,903 26,895 26,289 26,149 26,185 26,142 26,092 25.958 25,957 25.920 25,907 26,754 26,696 26.565 31 28 31 30 31 30 31 31 30 31 30 31 31 28 31 2.31105 2.09246 2.31596 2.19075 2.25172 2.18208 2.25112 2.24681 2.16317 2.23519 2.16000 2.23088 2.30382 2.07636 2.28754 58 89 [Hint] The variable NYRSB can be thought of as an inspection unit", representing an identical "arca of opportunity" for cach sample". The process characteristic" to bc controlled is the rate of CAT scans. A chart which monitors the average number of CAT scans per NYRSB is appropriate MTB > Stat > Control Charts > Attributes Charts >U Page 1 of 291 words X Text Predictions: On Accessibility: Investigate Focus 30 + 100% % 74"F Rain to stop 8:38 PM 9 5/15/2022


