

Question: w b. Construct NPV profiles for Projects A and B. Before we can graph the NPV profiles for these projects, we must create a data
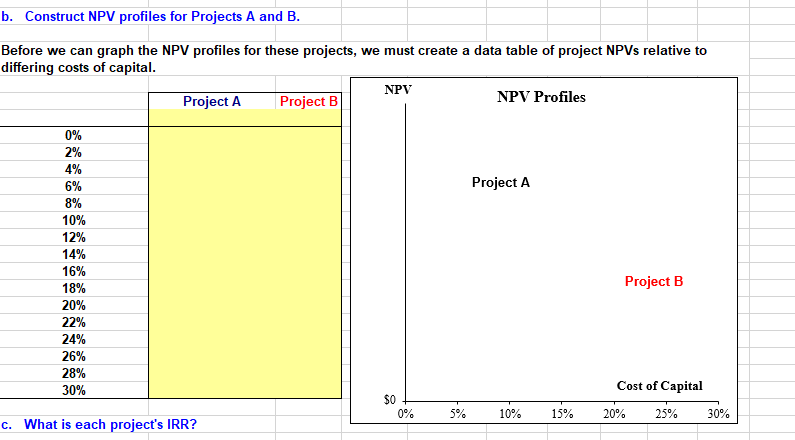

w b. Construct NPV profiles for Projects A and B. Before we can graph the NPV profiles for these projects, we must create a data table of project NPVs relative to differing costs of capital. NPV Project A Project B NPV Profiles Project A 0% 2% 4% 6% 8% 10% 12% 14% 16% 18% 20% 22% 24% 26% 28% 30% Project B Cost of Capital $0 0% 5% 10% 15% 20% 25% 30% C. What is each project's IRR? Time 0 1 2 3 4 5 OU WN Expected Net Cash Flows Project A Project B ($375) ($575) ($300) $190 ($200) $190 ($100) $190 $600 $190 $600 $190 $926 $190 ($200) $0 7
Step by Step Solution
There are 3 Steps involved in it
1 Expert Approved Answer
Step: 1 Unlock

Question Has Been Solved by an Expert!
Get step-by-step solutions from verified subject matter experts
Step: 2 Unlock
Step: 3 Unlock