

Question: w Based on historic data, we can break the prospects for the Store in Store concept into 4 scenarios. These can be described as follows:
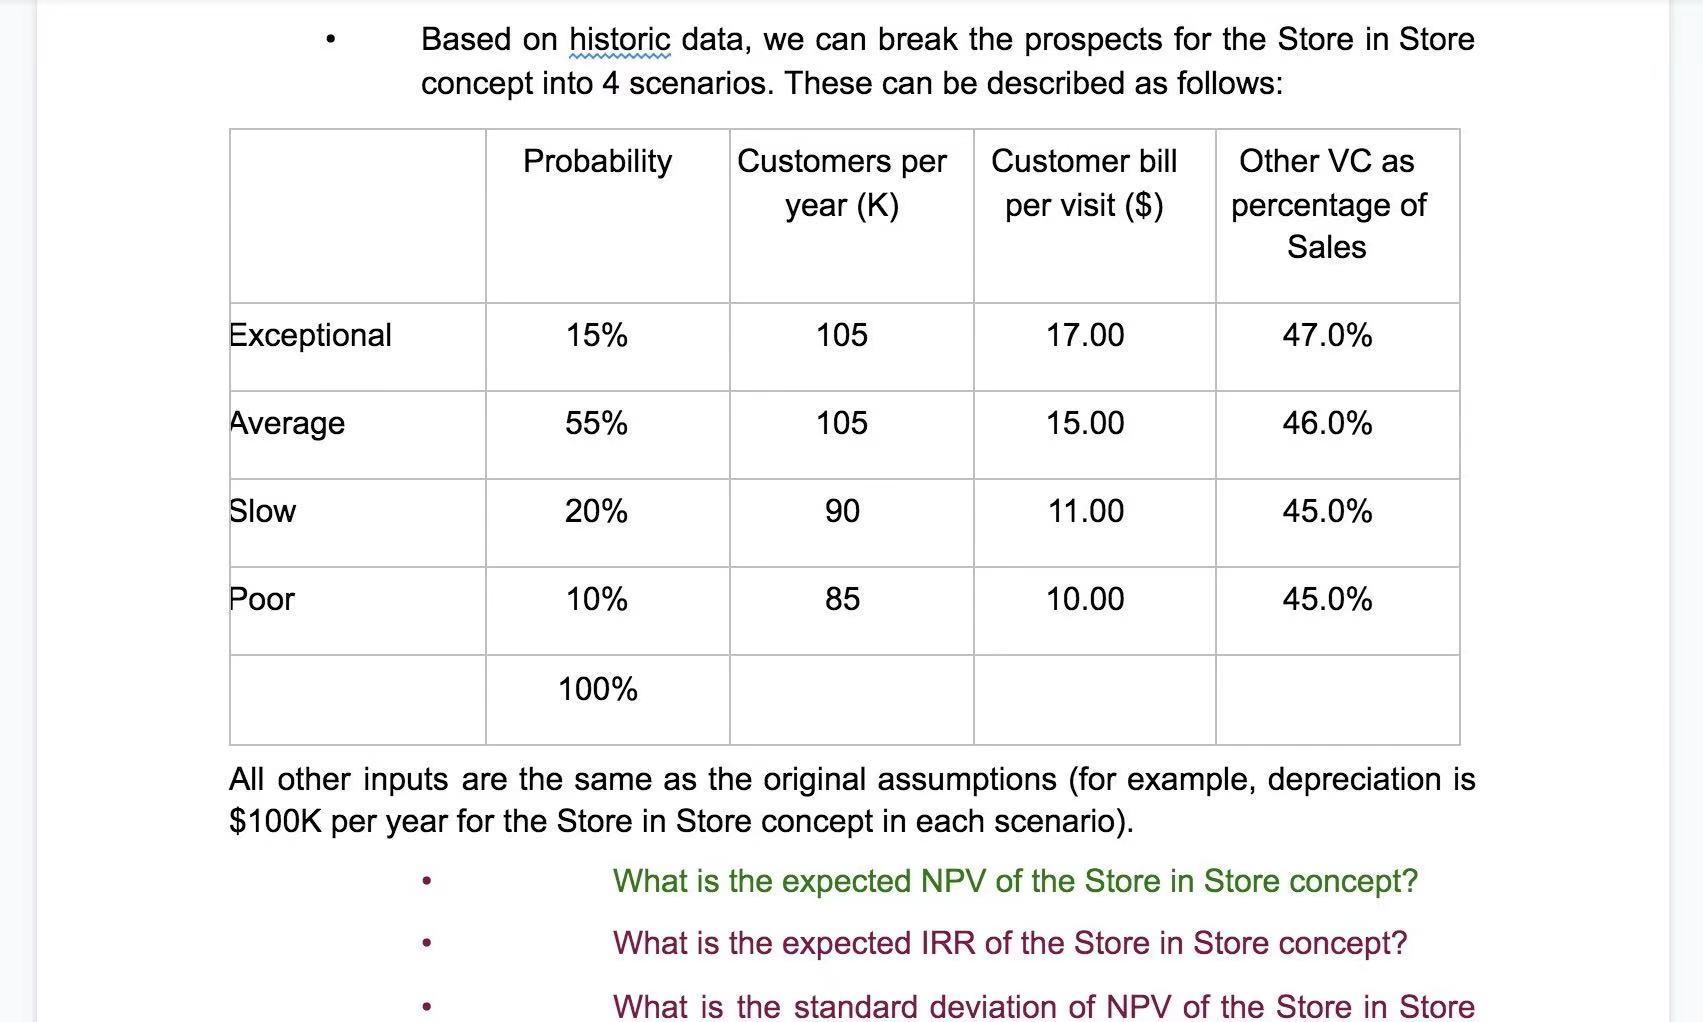
w Based on historic data, we can break the prospects for the Store in Store concept into 4 scenarios. These can be described as follows: Probability Customers per Customer bill per visit ($) year (K) Other VC as percentage of Sales Exceptional 15% 105 17.00 47.0% Average 55% 105 15.00 46.0% Slow 20% 90 11.00 45.0% Poor 10% 85 10.00 45.0% 100% All other inputs are the same as the original assumptions (for example, depreciation is $100K per year for the Store in Store concept in each scenario). What is the expected NPV of the Store in Store concept? What is the expected IRR of the Store in Store concept? What is the standard deviation of NPV of the Store in Store w Based on historic data, we can break the prospects for the Store in Store concept into 4 scenarios. These can be described as follows: Probability Customers per Customer bill per visit ($) year (K) Other VC as percentage of Sales Exceptional 15% 105 17.00 47.0% Average 55% 105 15.00 46.0% Slow 20% 90 11.00 45.0% Poor 10% 85 10.00 45.0% 100% All other inputs are the same as the original assumptions (for example, depreciation is $100K per year for the Store in Store concept in each scenario). What is the expected NPV of the Store in Store concept? What is the expected IRR of the Store in Store concept? What is the standard deviation of NPV of the Store in Store
Step by Step Solution
There are 3 Steps involved in it

Get step-by-step solutions from verified subject matter experts