

Question: Walmart Inc. Dividend growth rate (g) implied by PRAT model Selected Financial Data (US$ in millions) Cash dividends declared Consolidated net income attributable to
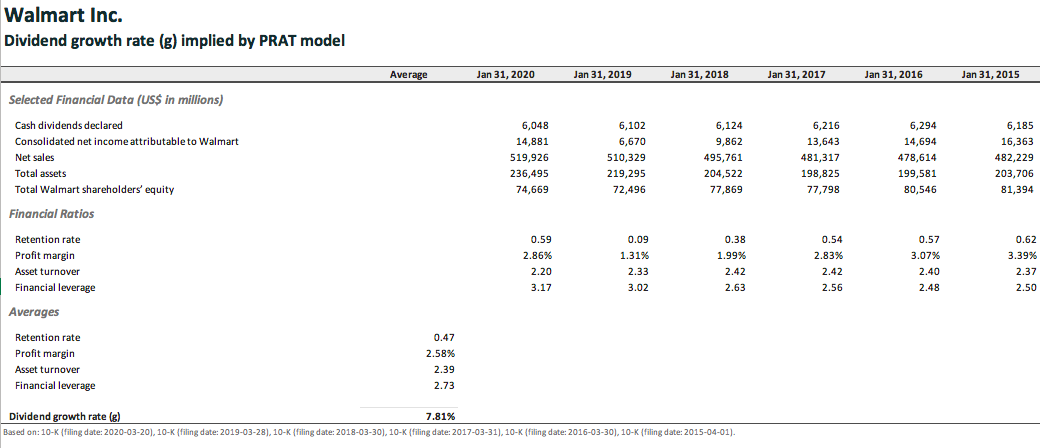
Walmart Inc. Dividend growth rate (g) implied by PRAT model Selected Financial Data (US$ in millions) Cash dividends declared Consolidated net income attributable to Walmart Net sales Total assets Total Walmart shareholders' equity Financial Ratios Retention rate Profit margin Asset turnover Financial leverage Averages Retention rate Profit margin Asset turnover Financial leverage Dividend growth rate (g) Average Jan 31, 2020 Jan 31, 2019 Jan 31, 2018 Jan 31, 2017 Jan 31, 2016 Jan 31, 2015 0.47 2.58% 2.39 2.73 6,048 14,881 6,102 6,124 6,216 6,294 6,670 9,862 13,643 14,694 519,926 510,329 495,761 481,317 478,614 6,185 16,363 482,229 236,495 219,295 204,522 198,825 199,581 203,706 74,669 72,496 77,869 77,798 80,546 81,394 0.59 2.86% 0.09 0.38 0.54 0.57 0.62 1.31% 1.99% 2.83% 3.07% 3.39% 2.20 2.33 2.42 2.42 2.40 2.37 3.17 3.02 2.63 2.56 2.48 2.50 7.81% Based on: 10-K (filing date: 2020-03-20), 10-K (filing date: 2019-03-28), 10-K (filing date: 2018-03-30), 10-K (filing date: 2017-03-31), 10-K (filing date: 2016-03-30), 10-K (filing date: 2015-04-01).
Step by Step Solution
There are 3 Steps involved in it

Get step-by-step solutions from verified subject matter experts