

Question: Walmart Stores, Inc. ( Walmart ) is the largest retailing firm in the world. Building on a base of discount stores, Walmart has expanded into
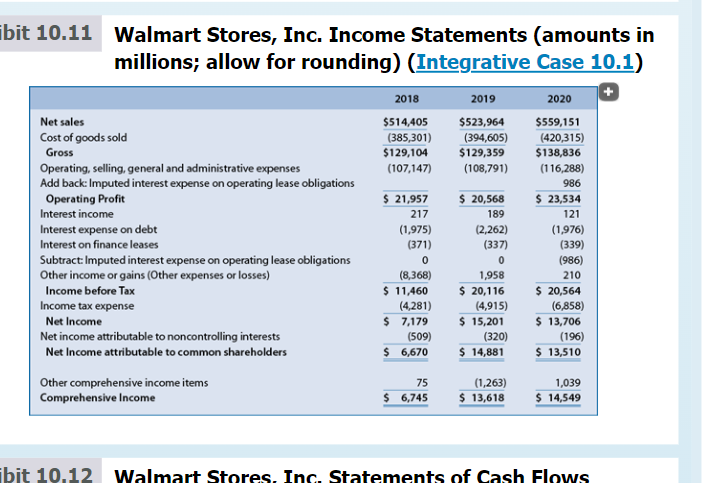
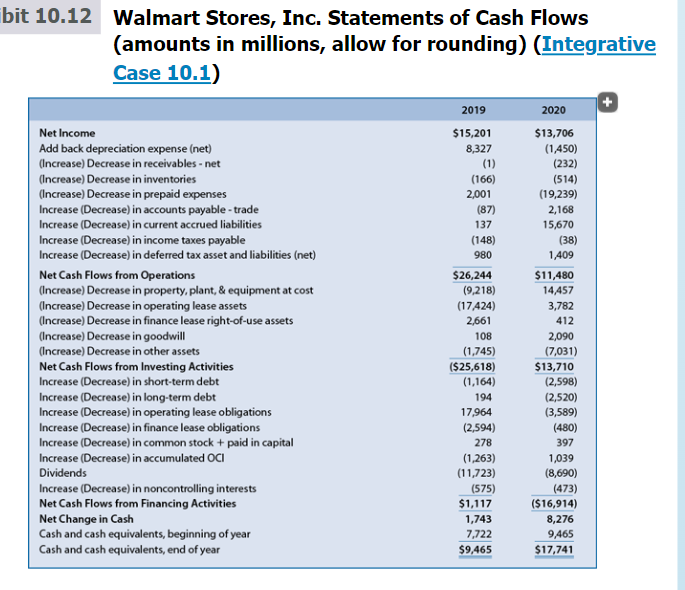
Walmart Stores, Inc. (Walmart) is the largest retailing firm in the world. Building on a base of discount stores, Walmart has expanded into warehouse clubs and Supercenters, which sell traditional discount store items and grocery products. Exhibits 10.10, 10.11, and 10.12 present the financial statements of Walmart for fiscal years 20182020. In these exhibits we provide modified Walmart financial statements to facilitate forecasting. Specifically, in Exhibit 10.11 we include on the income statement the adjustment for imputed interest expense on operating lease obligations. In addition, in Exhibit 10.12, we provide the implied statements of cash flows for fiscal 2019 and 2020, including implied cash flows for changes in operating lease assets and obligations. For your reference, Exhibits 4.50, 4.51, and 4.52 (Case 4.2 in Chapter 4) present summary financial statements for Walmart based on U.S. GAAP, and Exhibit 4.53 presents selected financial statement ratios for Years 20182020. (Note: A few of the amounts presented in Chapter 4 for Walmart differ slightly from the amounts provided here because, for purposes of computing financial analysis ratios, the Chapter 4 data have been adjusted slightly to remove the effects of nonrecurring items such as discontinued operations.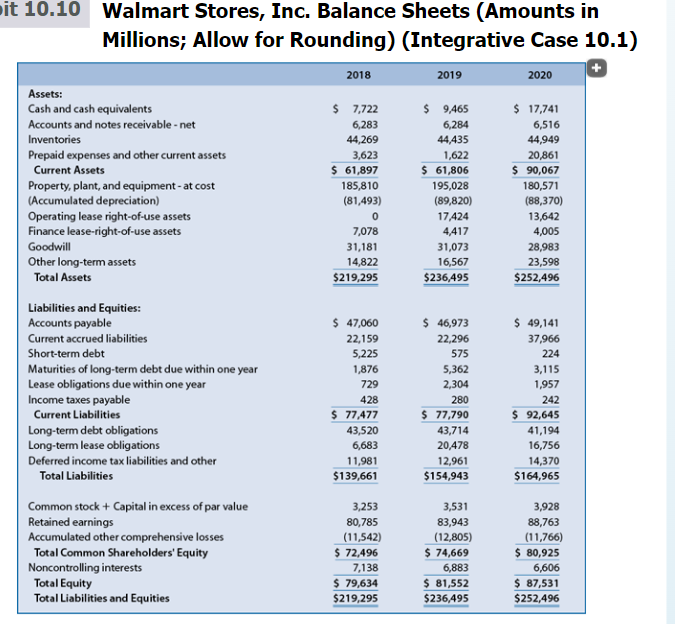
-
Design a spreadsheet and prepare a set of financial statement forecasts for Walmart for Year +1 to Year +5 using the assumptions that follow. Project the amounts in the order presented (unless indicated otherwise) beginning with the income statement, then the balance sheet, and then the statement of cash flows. For this portion of the case, assume that Walmart will exercise its financial flexibility with the cash and cash equivalents account to balance the balance sheet.
it 10.10 Walmart Stores, Inc. Balance Sheets (Amounts in Millions; Allow for Rounding) (Integrative Case 10.1) 2018 2019 2020 Assets: Cash and cash equivalents $ 7,722 $ 9,465 $ 17,741 Accounts and notes receivable - net 6,283 6,284 6,516 Inventories 44,269 44,435 44,949 Prepaid expenses and other current assets 3,623 1,622 20,861 Current Assets $ 61,897 $ 61,806 $ 90,067 Property, plant, and equipment at cost 185,810 195,028 180,571 (Accumulated depreciation) (81,493) (89,820) (88,370) Operating lease right-of-use assets 0 17424 13,642 Finance lease-right-of-use assets 7,078 4,417 4,005 Goodwill 31,181 31,073 28,983 Other long-term assets 14,822 16,567 23,598 Total Assets $219,295 $236,495 $252,496 Liabilities and Equities: Accounts payable Current accrued liabilities Short-term debt Maturities of long-term debt due within one year Lease obligations due within one year Income taxes payable Current Liabilities Long-term debt obligations Long-term lease obligations Deferred income tax liabilities and other Total Liabilities $ 47,060 22,159 5,225 1,876 729 428 $ 77,477 43,520 6,683 11,981 $139,661 $ 46,973 22,296 575 5,362 2,304 280 $ 77,790 43,714 20,478 12,961 $154,943 $ 49,141 37,966 224 3,115 1,957 242 $ 92,645 41,194 16,756 14,370 $164,965 Common stock + Capital in excess of par value Retained earnings Accumulated other comprehensive losses Total Common Shareholders' Equity Noncontrolling interests Total Equity Total Liabilities and Equities 3,253 80,785 (11,542) $ 72,496 7,138 $ 79,634 $219,295 3,531 83,943 (12,805) $ 74,669 6,883 $ 81,552 $236,495 3,928 88,763 (11,766) $ 80,925 6,606 $ 87,531 $252,496 ibit 10.11 Walmart Stores, Inc. Income Statements (amounts in millions; allow for rounding) (Integrative Case 10.1) 2018 $514,405 (385,301) $129,104 (107,147) 2019 $523,964 (394,605) $129,359 (108,791) Net sales Cost of goods sold Gross Operating, selling, general and administrative expenses Add back: Imputed interest expense on operating lease obligations Operating Profit Interest income Interest expense on debt Interest on finance leases Subtract: Imputed interest expense on operating lease obligations Other income or gains (Other expenses or losses) Income before Tax Income tax expense Net Income Net income attributable to noncontrolling interests Net Income attributable to common shareholders $ 21,957 217 (1,975) (371) 0 (8,368) $ 11,460 (4,281) $ 7,179 (509) $ 6,670 $ 20,568 189 (2,262) (337) 0 1,958 $ 20,116 (4,915) $ 15,201 (320) $ 14,881 2020 $559,151 (420,315) $138,836 (116,288) 986 $ 23,534 121 (1,976) (339) (986) 210 $ 20,564 (6,858) $ 13,706 (196) $ 13,510 Other comprehensive income items Comprehensive Income 75 $ 6,745 (1,263) $ 13,618 1,039 $ 14,549 ibit 10.12 Walmart Stores. Inc. Statements of Cash Flows bit 10.12 Walmart Stores, Inc. Statements of Cash Flows (amounts in millions, allow for rounding) (Integrative Case 10.1) 2019 $15,201 8,327 (1) (166) 2,001 (87) 137 (148) 980 Net Income Add back depreciation expense (net) (Increase) Decrease in receivables - net (Increase) Decrease in inventories (Increase) Decrease in prepaid expenses Increase (Decrease) in accounts payable - trade Increase (Decrease) in current accrued liabilities Increase (Decrease) in income taxes payable Increase (Decrease) in deferred tax asset and liabilities (net) Net Cash Flows from Operations (Increase) Decrease in property, plant, & equipment at cost (Increase) Decrease in operating lease assets (Increase) Decrease in finance lease right-of-use assets (Increase) Decrease in goodwill (Increase) Decrease in other assets Net Cash Flows from Investing Activities Increase (Decrease) in short-term debt Increase (Decrease) in long-term debt Increase (Decrease) in operating lease obligations Increase (Decrease) in finance lease obligations Increase (Decrease) in common stock + paid in capital Increase (Decrease) in accumulated OCI Dividends Increase (Decrease) in noncontrolling interests Net Cash Flows from Financing Activities Net Change in Cash Cash and cash equivalents, beginning of year Cash and cash equivalents, end of year $26,244 (9,218) (17424) 2,661 108 (1,745) ($25,618) (1,164) 194 17,964 (2,594) 278 (1,263) (11,723) (575) $1,117 1,743 7,722 $9,465 2020 $13,706 (1,450) (232) (514) (19,239) 2,168 15,670 (38) 1,409 $11,480 14,457 3,782 412 2,090 (7,031) $13,710 (2,598) (2,520) (3,589) (480) 397 1,039 (8,690) (473) ($16,914) 8,276 9,465 $17,741 it 10.10 Walmart Stores, Inc. Balance Sheets (Amounts in Millions; Allow for Rounding) (Integrative Case 10.1) 2018 2019 2020 Assets: Cash and cash equivalents $ 7,722 $ 9,465 $ 17,741 Accounts and notes receivable - net 6,283 6,284 6,516 Inventories 44,269 44,435 44,949 Prepaid expenses and other current assets 3,623 1,622 20,861 Current Assets $ 61,897 $ 61,806 $ 90,067 Property, plant, and equipment at cost 185,810 195,028 180,571 (Accumulated depreciation) (81,493) (89,820) (88,370) Operating lease right-of-use assets 0 17424 13,642 Finance lease-right-of-use assets 7,078 4,417 4,005 Goodwill 31,181 31,073 28,983 Other long-term assets 14,822 16,567 23,598 Total Assets $219,295 $236,495 $252,496 Liabilities and Equities: Accounts payable Current accrued liabilities Short-term debt Maturities of long-term debt due within one year Lease obligations due within one year Income taxes payable Current Liabilities Long-term debt obligations Long-term lease obligations Deferred income tax liabilities and other Total Liabilities $ 47,060 22,159 5,225 1,876 729 428 $ 77,477 43,520 6,683 11,981 $139,661 $ 46,973 22,296 575 5,362 2,304 280 $ 77,790 43,714 20,478 12,961 $154,943 $ 49,141 37,966 224 3,115 1,957 242 $ 92,645 41,194 16,756 14,370 $164,965 Common stock + Capital in excess of par value Retained earnings Accumulated other comprehensive losses Total Common Shareholders' Equity Noncontrolling interests Total Equity Total Liabilities and Equities 3,253 80,785 (11,542) $ 72,496 7,138 $ 79,634 $219,295 3,531 83,943 (12,805) $ 74,669 6,883 $ 81,552 $236,495 3,928 88,763 (11,766) $ 80,925 6,606 $ 87,531 $252,496 ibit 10.11 Walmart Stores, Inc. Income Statements (amounts in millions; allow for rounding) (Integrative Case 10.1) 2018 $514,405 (385,301) $129,104 (107,147) 2019 $523,964 (394,605) $129,359 (108,791) Net sales Cost of goods sold Gross Operating, selling, general and administrative expenses Add back: Imputed interest expense on operating lease obligations Operating Profit Interest income Interest expense on debt Interest on finance leases Subtract: Imputed interest expense on operating lease obligations Other income or gains (Other expenses or losses) Income before Tax Income tax expense Net Income Net income attributable to noncontrolling interests Net Income attributable to common shareholders $ 21,957 217 (1,975) (371) 0 (8,368) $ 11,460 (4,281) $ 7,179 (509) $ 6,670 $ 20,568 189 (2,262) (337) 0 1,958 $ 20,116 (4,915) $ 15,201 (320) $ 14,881 2020 $559,151 (420,315) $138,836 (116,288) 986 $ 23,534 121 (1,976) (339) (986) 210 $ 20,564 (6,858) $ 13,706 (196) $ 13,510 Other comprehensive income items Comprehensive Income 75 $ 6,745 (1,263) $ 13,618 1,039 $ 14,549 ibit 10.12 Walmart Stores. Inc. Statements of Cash Flows bit 10.12 Walmart Stores, Inc. Statements of Cash Flows (amounts in millions, allow for rounding) (Integrative Case 10.1) 2019 $15,201 8,327 (1) (166) 2,001 (87) 137 (148) 980 Net Income Add back depreciation expense (net) (Increase) Decrease in receivables - net (Increase) Decrease in inventories (Increase) Decrease in prepaid expenses Increase (Decrease) in accounts payable - trade Increase (Decrease) in current accrued liabilities Increase (Decrease) in income taxes payable Increase (Decrease) in deferred tax asset and liabilities (net) Net Cash Flows from Operations (Increase) Decrease in property, plant, & equipment at cost (Increase) Decrease in operating lease assets (Increase) Decrease in finance lease right-of-use assets (Increase) Decrease in goodwill (Increase) Decrease in other assets Net Cash Flows from Investing Activities Increase (Decrease) in short-term debt Increase (Decrease) in long-term debt Increase (Decrease) in operating lease obligations Increase (Decrease) in finance lease obligations Increase (Decrease) in common stock + paid in capital Increase (Decrease) in accumulated OCI Dividends Increase (Decrease) in noncontrolling interests Net Cash Flows from Financing Activities Net Change in Cash Cash and cash equivalents, beginning of year Cash and cash equivalents, end of year $26,244 (9,218) (17424) 2,661 108 (1,745) ($25,618) (1,164) 194 17,964 (2,594) 278 (1,263) (11,723) (575) $1,117 1,743 7,722 $9,465 2020 $13,706 (1,450) (232) (514) (19,239) 2,168 15,670 (38) 1,409 $11,480 14,457 3,782 412 2,090 (7,031) $13,710 (2,598) (2,520) (3,589) (480) 397 1,039 (8,690) (473) ($16,914) 8,276 9,465 $17,741
Step by Step Solution
There are 3 Steps involved in it

Get step-by-step solutions from verified subject matter experts