

Question: want it as a matlab code 1. Plot the function: 2cos(200t) which is sampled with frequency 1kHz for 3 periods. Give the plot a title,
want it as a matlab code 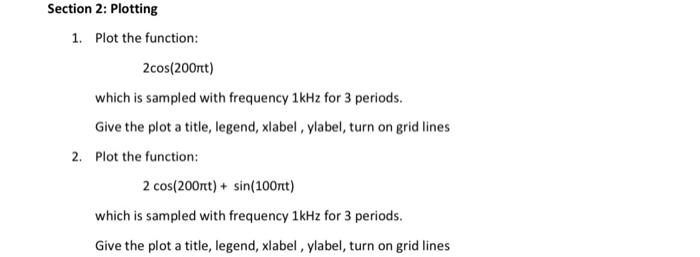
1. Plot the function: 2cos(200t) which is sampled with frequency 1kHz for 3 periods. Give the plot a title, legend, xlabel, ylabel, turn on grid lines 2. Plot the function: 2cos(200t)+sin(100t) which is sampled with frequency 1kHz for 3 periods. Give the plot a title, legend, xlabel, ylabel, turn on grid lines
Step by Step Solution
There are 3 Steps involved in it
1 Expert Approved Answer
Step: 1 Unlock

Question Has Been Solved by an Expert!
Get step-by-step solutions from verified subject matter experts
Step: 2 Unlock
Step: 3 Unlock