

Question: want to verify my answer. Question 7 Answer saved Points out of 6.60 V Flag question Make a scatter diagram for the data. Use the
want to verify my answer.
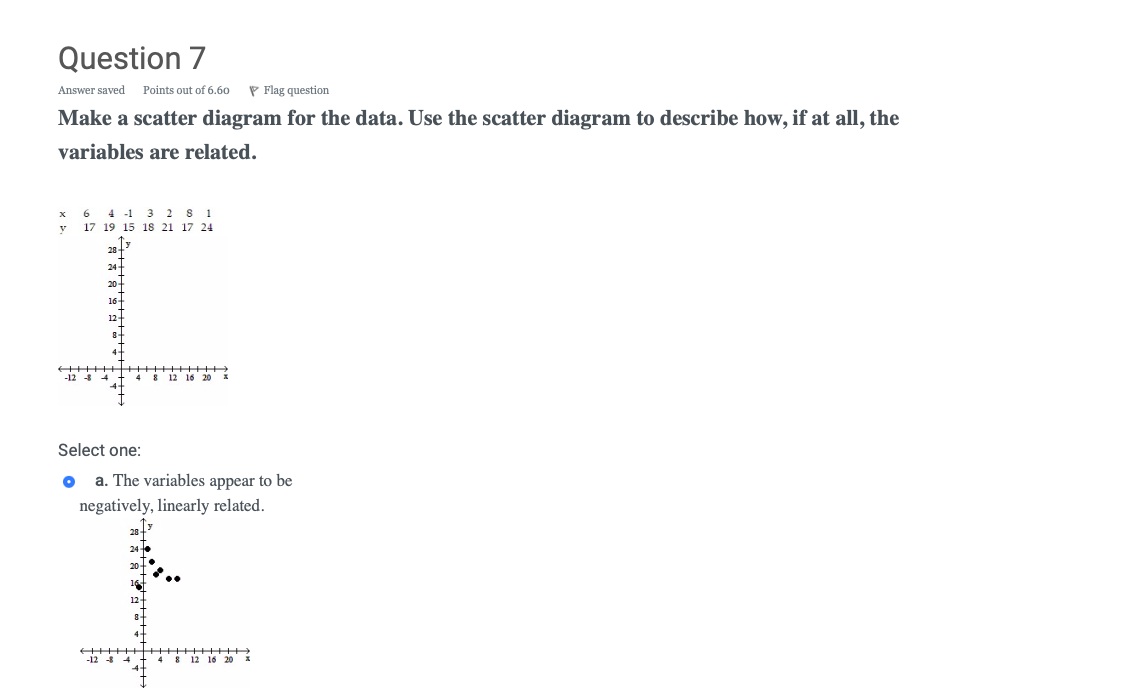
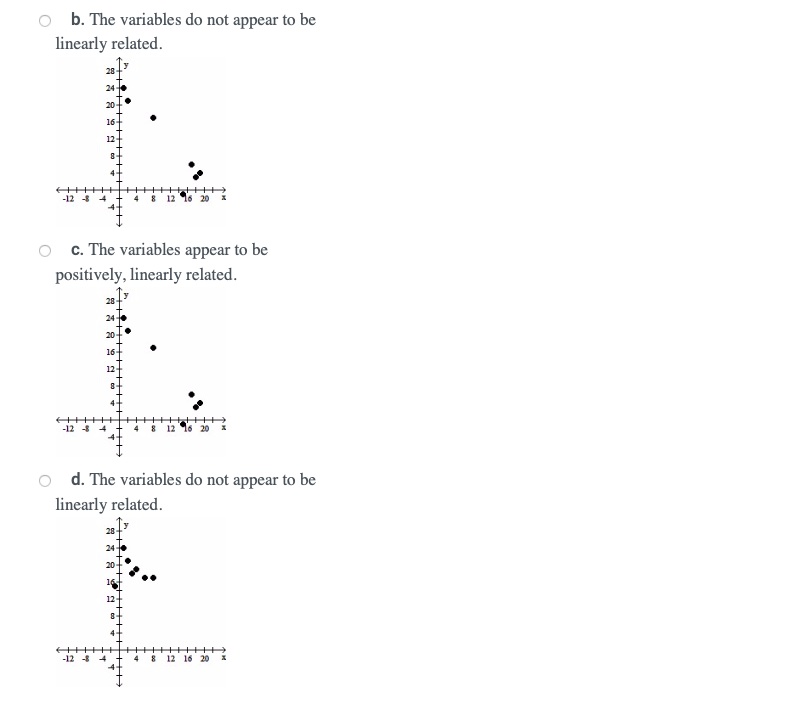
Question 7 Answer saved Points out of 6.60 V Flag question Make a scatter diagram for the data. Use the scatter diagram to describe how, if at all, the variables are related. 6 4 -1 2 S 17 19 15 18 21 17 24 1 28- 24- 20 16- -12 -8 12 16 20 Select one: o a. The variables appear to be negatively, linearly related. 28- 24- 20 12- -$4 8 12 16 20O b. The variables do not appear to be linearly related. 28- 24- 20 16 - 12- -12 -8 4 8 12 16 20 O c. The variables appear to be positively, linearly related. 24 . 20- 16- 12 16 O d. The variables do not appear to be linearly related. 28 - 24- 20 16 12+ 12 16
Step by Step Solution
There are 3 Steps involved in it
1 Expert Approved Answer
Step: 1 Unlock

Question Has Been Solved by an Expert!
Get step-by-step solutions from verified subject matter experts
Step: 2 Unlock
Step: 3 Unlock