

Question: We analyzed 50 processing times (listed in Table 2.4) for the development of price quotes by the manufacturer of industrial wheels. The intent was to
We analyzed 50 processing times (listed in Table 2.4) for the development of price quotes by the manufacturer of industrial wheels. The intent was to determine whether the success or failure in obtaining the order was related to the amount of time to process the price quotes. Each quote that corresponds to “lost” business was so classified. Use a statistical software package to draw a box plot for all 50 processing times. What does the box plot reveal about the data? Identify any outliers in the data set.
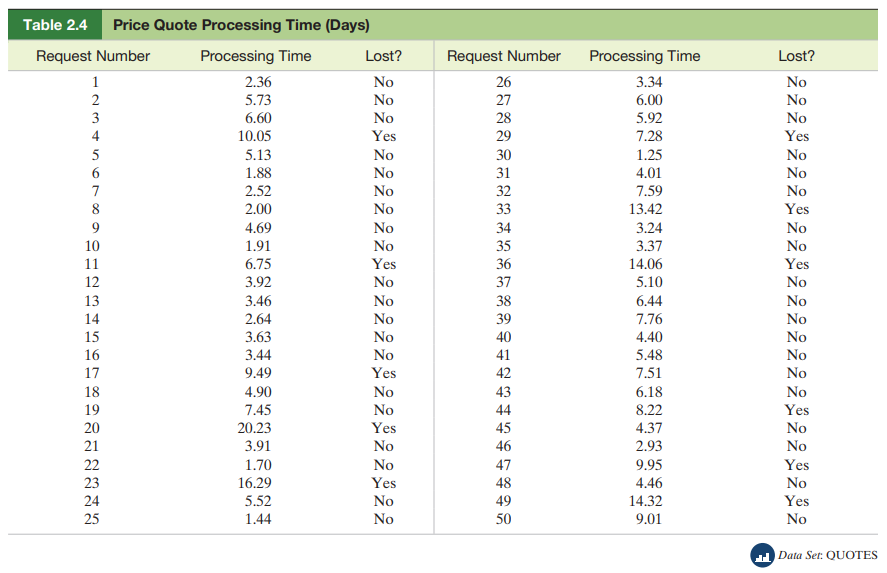
Table 2.4 Price Quote Processing Time (Days) Request Number Processing Time 12345oroa9 6 7 8 10 11 12 13 14 15 16 17 18 19 20 21 22 23 24 25 2.36 5.73 6.60 10.05 5.13 1.88 2.52 2.00 4.69 1.91 6.75 3.92 3.46 2.64 3.63 3.44 9.49 4.90 7.45 20.23 3.91 1.70 16.29 5.52 1.44 Lost? No No No Yes No No No No No No Yes No No No No No Yes No No Yes No No Yes No No Request Number 26 27 28 29 30 31 32 33 34 35 36 37 38 39 40 41 42 43 44 45 46 47 48 49 50 Processing Time 3.34 6.00 5.92 7.28 1.25 4.01 7.59 13.42 3.24 3.37 14.06 5.10 6.44 7.76 4.40 5.48 7.51 6.18 8.22 4.37 2.93 9.95 4.46 14.32 9.01 Lost? No No No Yes No No No Yes No No Yes No No No No No No No Yes No No Yes No Yes No Data Set: QUOTES
Step by Step Solution
3.43 Rating (156 Votes )
There are 3 Steps involved in it
To draw a box plot for the given data set we can use a statistical software package or create it man... View full answer

Get step-by-step solutions from verified subject matter experts