

Question: We are doing a risk management project. We aim to examine whether an actively managed portfolio can outperform the Hang Seng Index(HSI) in the Hong
We are doing a risk management project. We aim to examine whether an actively managed portfolio can outperform the Hang Seng Index(HSI) in the Hong Kong stock market. We have collected the stock price data of four representative companies: Tencent Holdings, China Resources Medical, HSBC Holdings and CK Hutchison Holdings and HSI data(daily rate of return HSI) from 2022 to 2024, using 2022-2023 for model construction and 2024 for testing. We use Excel for data analysis and optimization, and use the Solver to assign different weights to the four stocks to construct an investment portfolio to maximize three matrics: Sharpe Ratio, Treynor Ratio, Jensen Alpha.
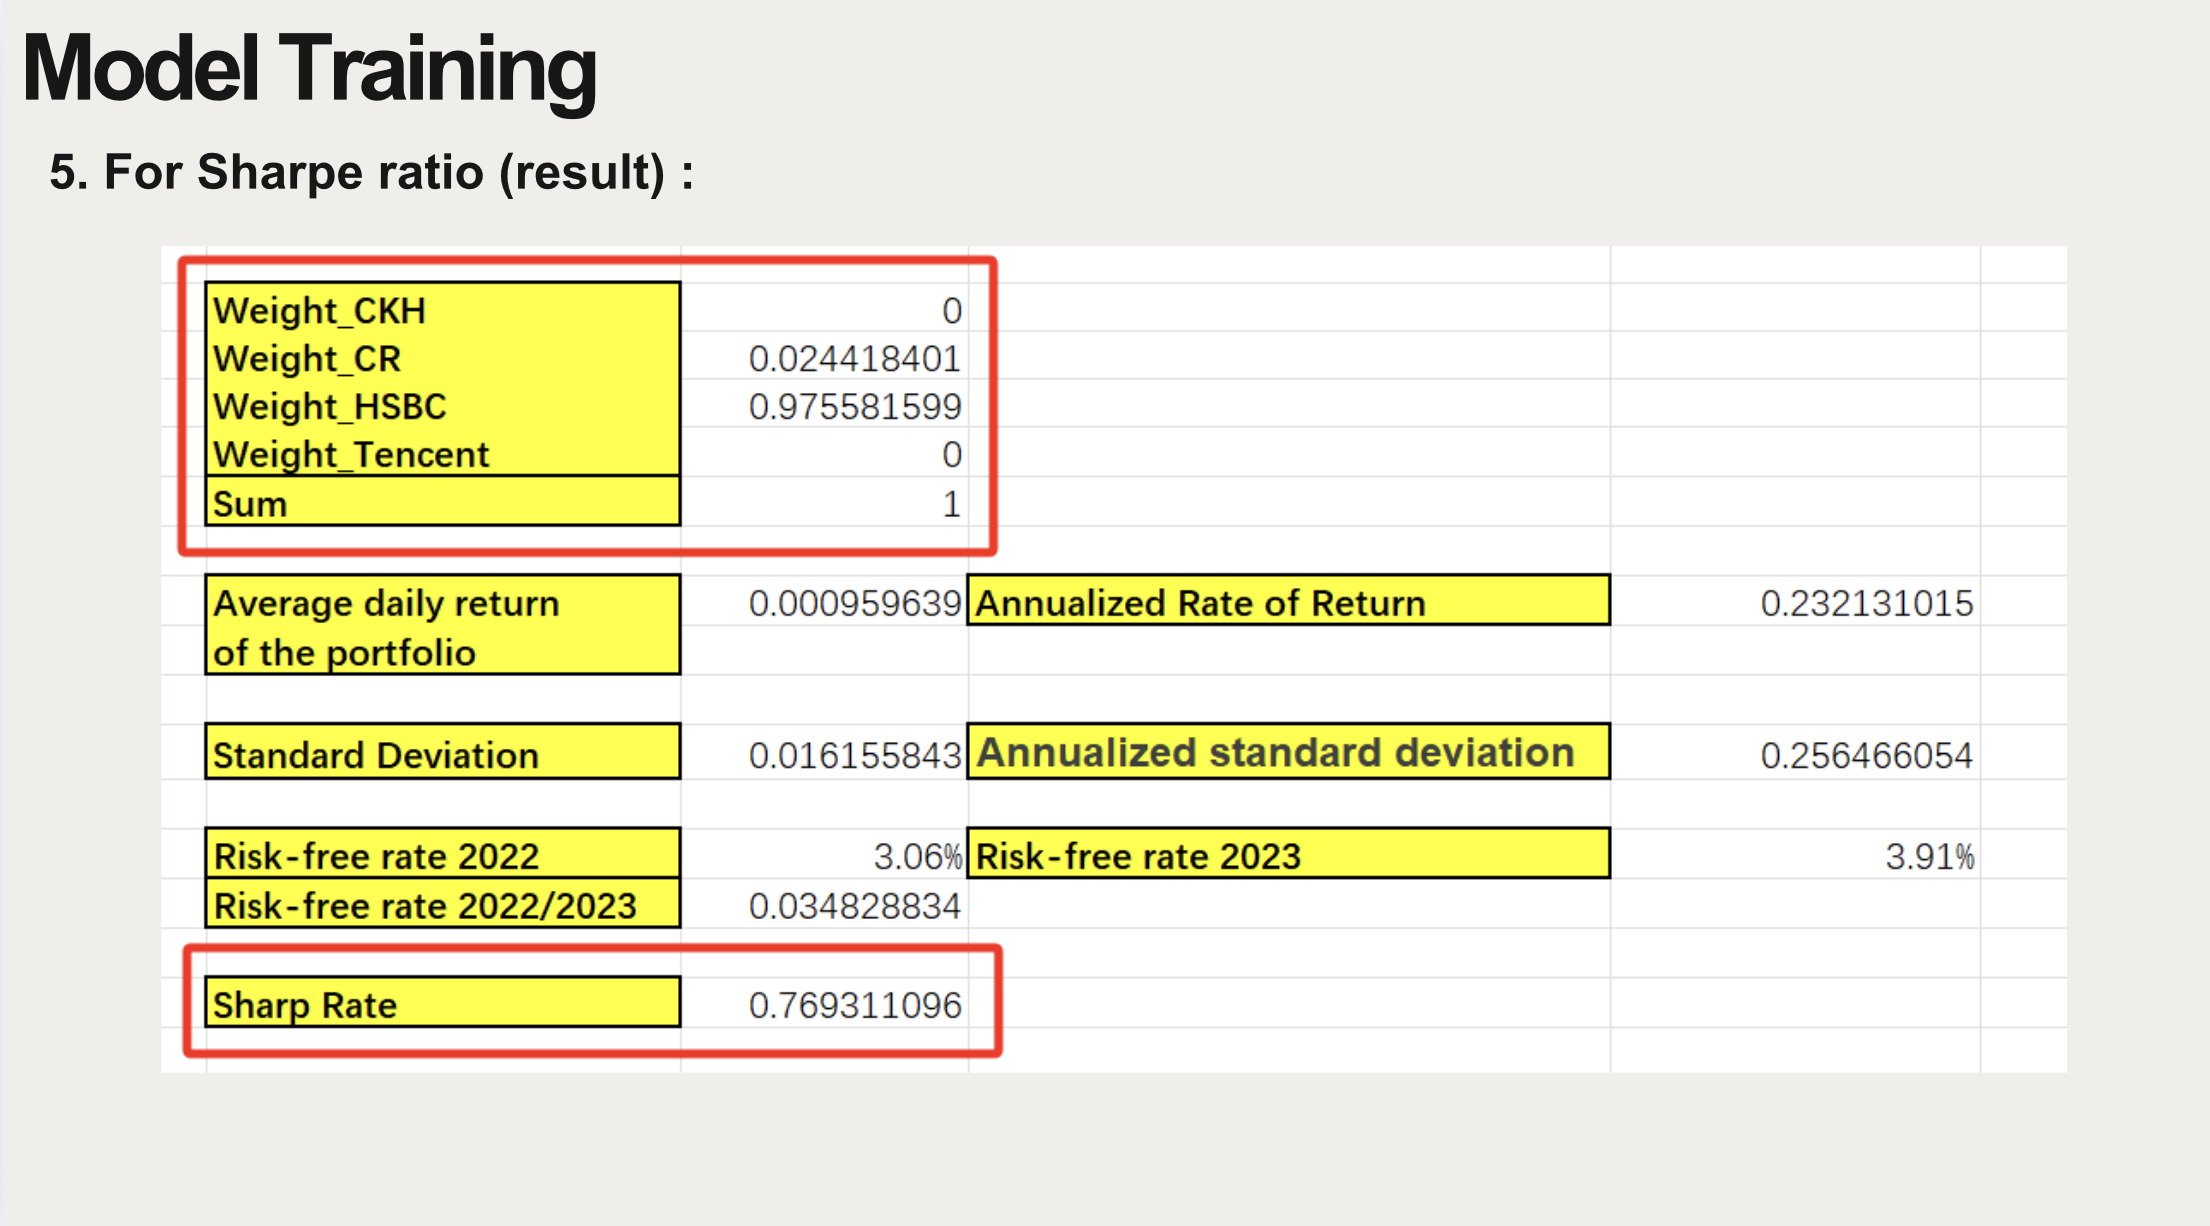
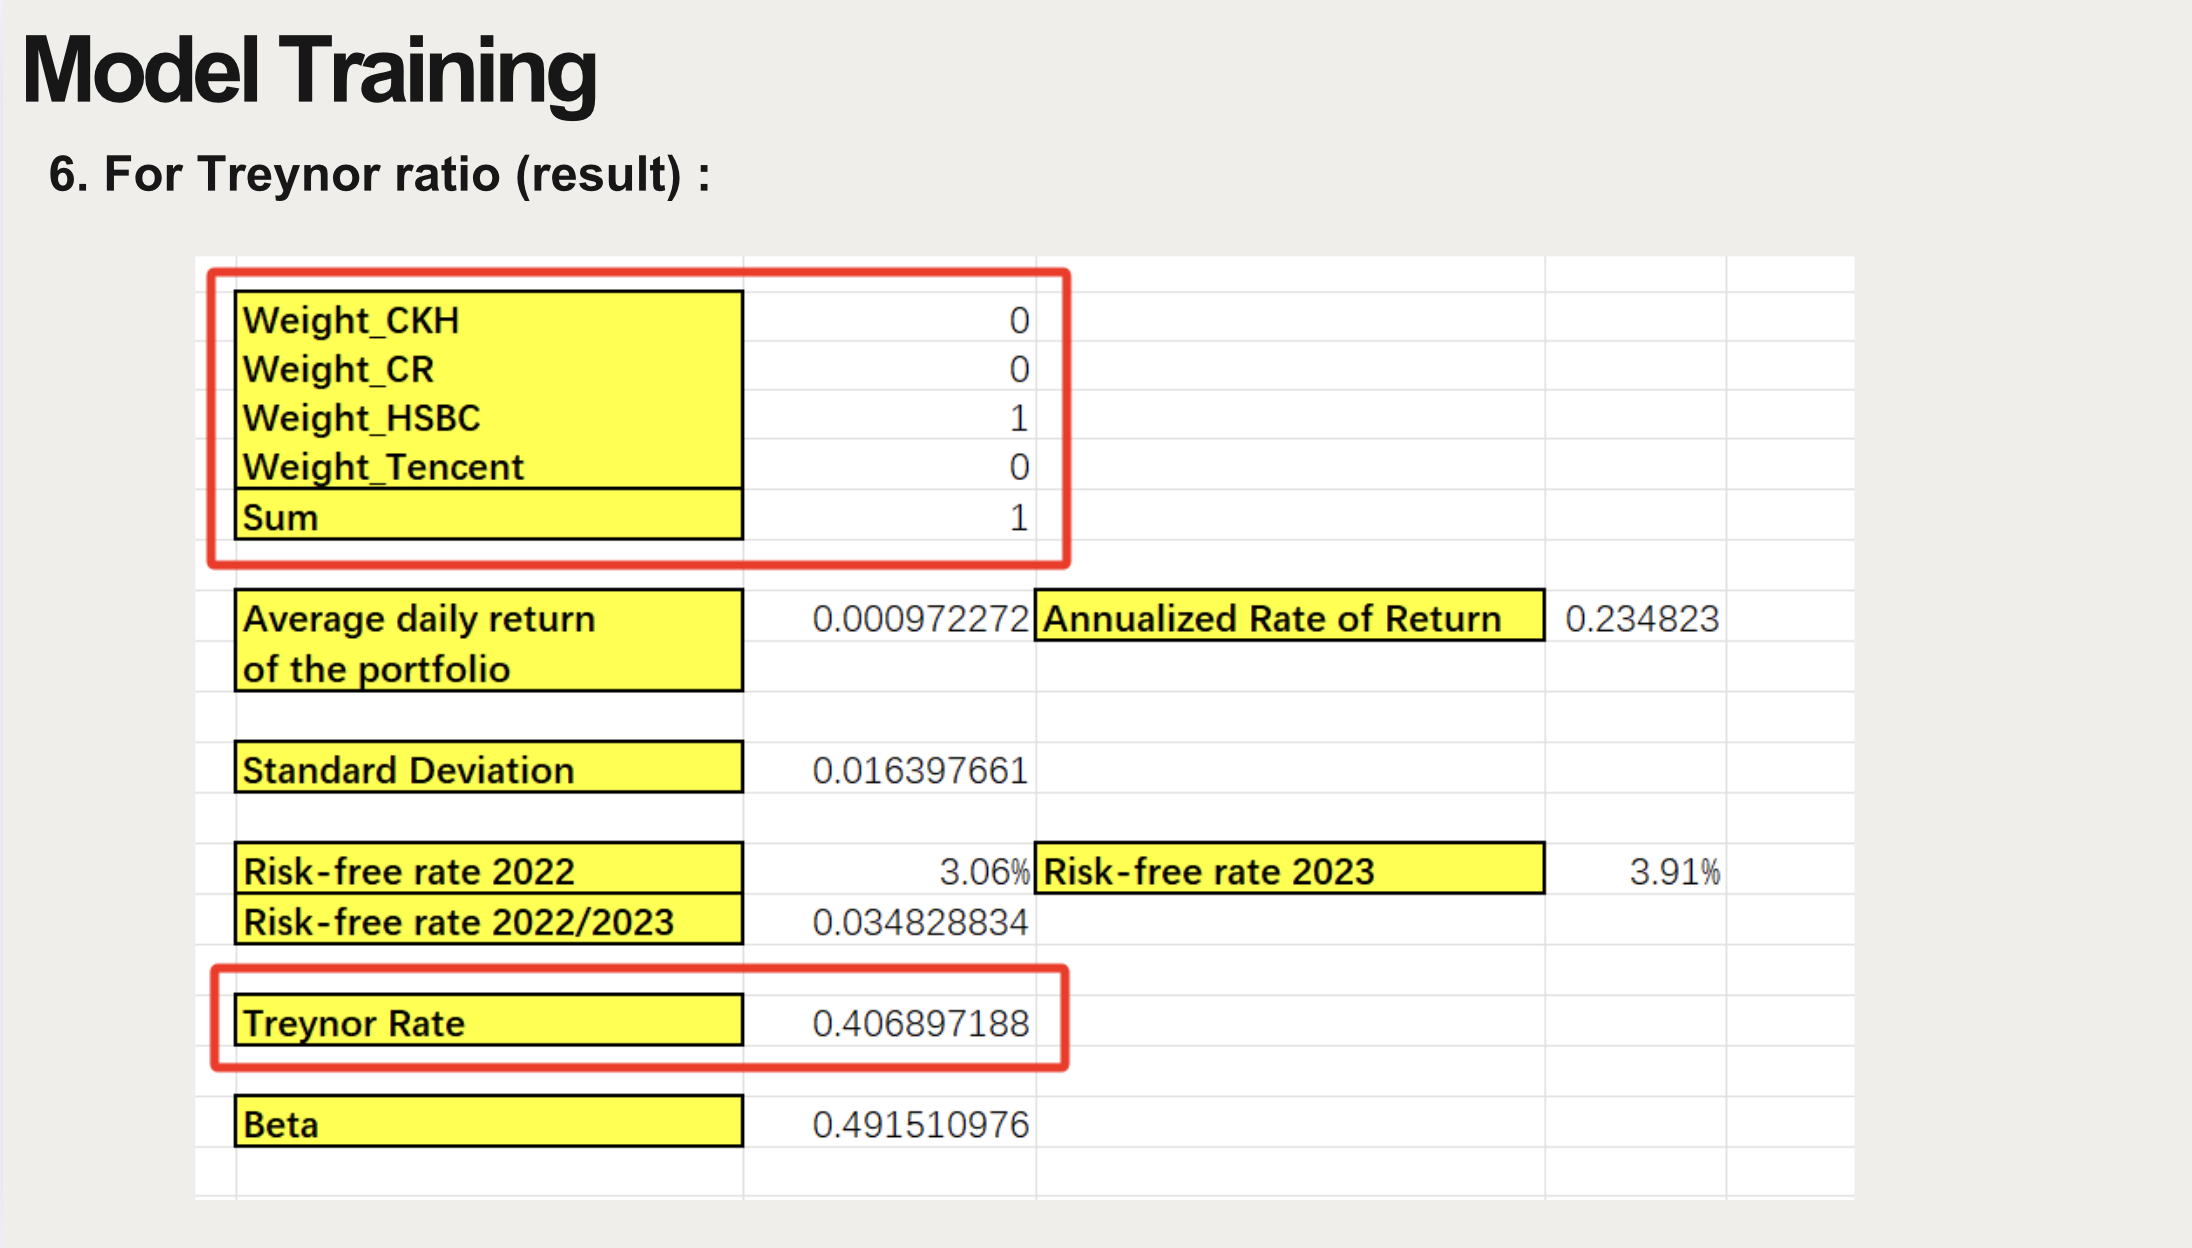
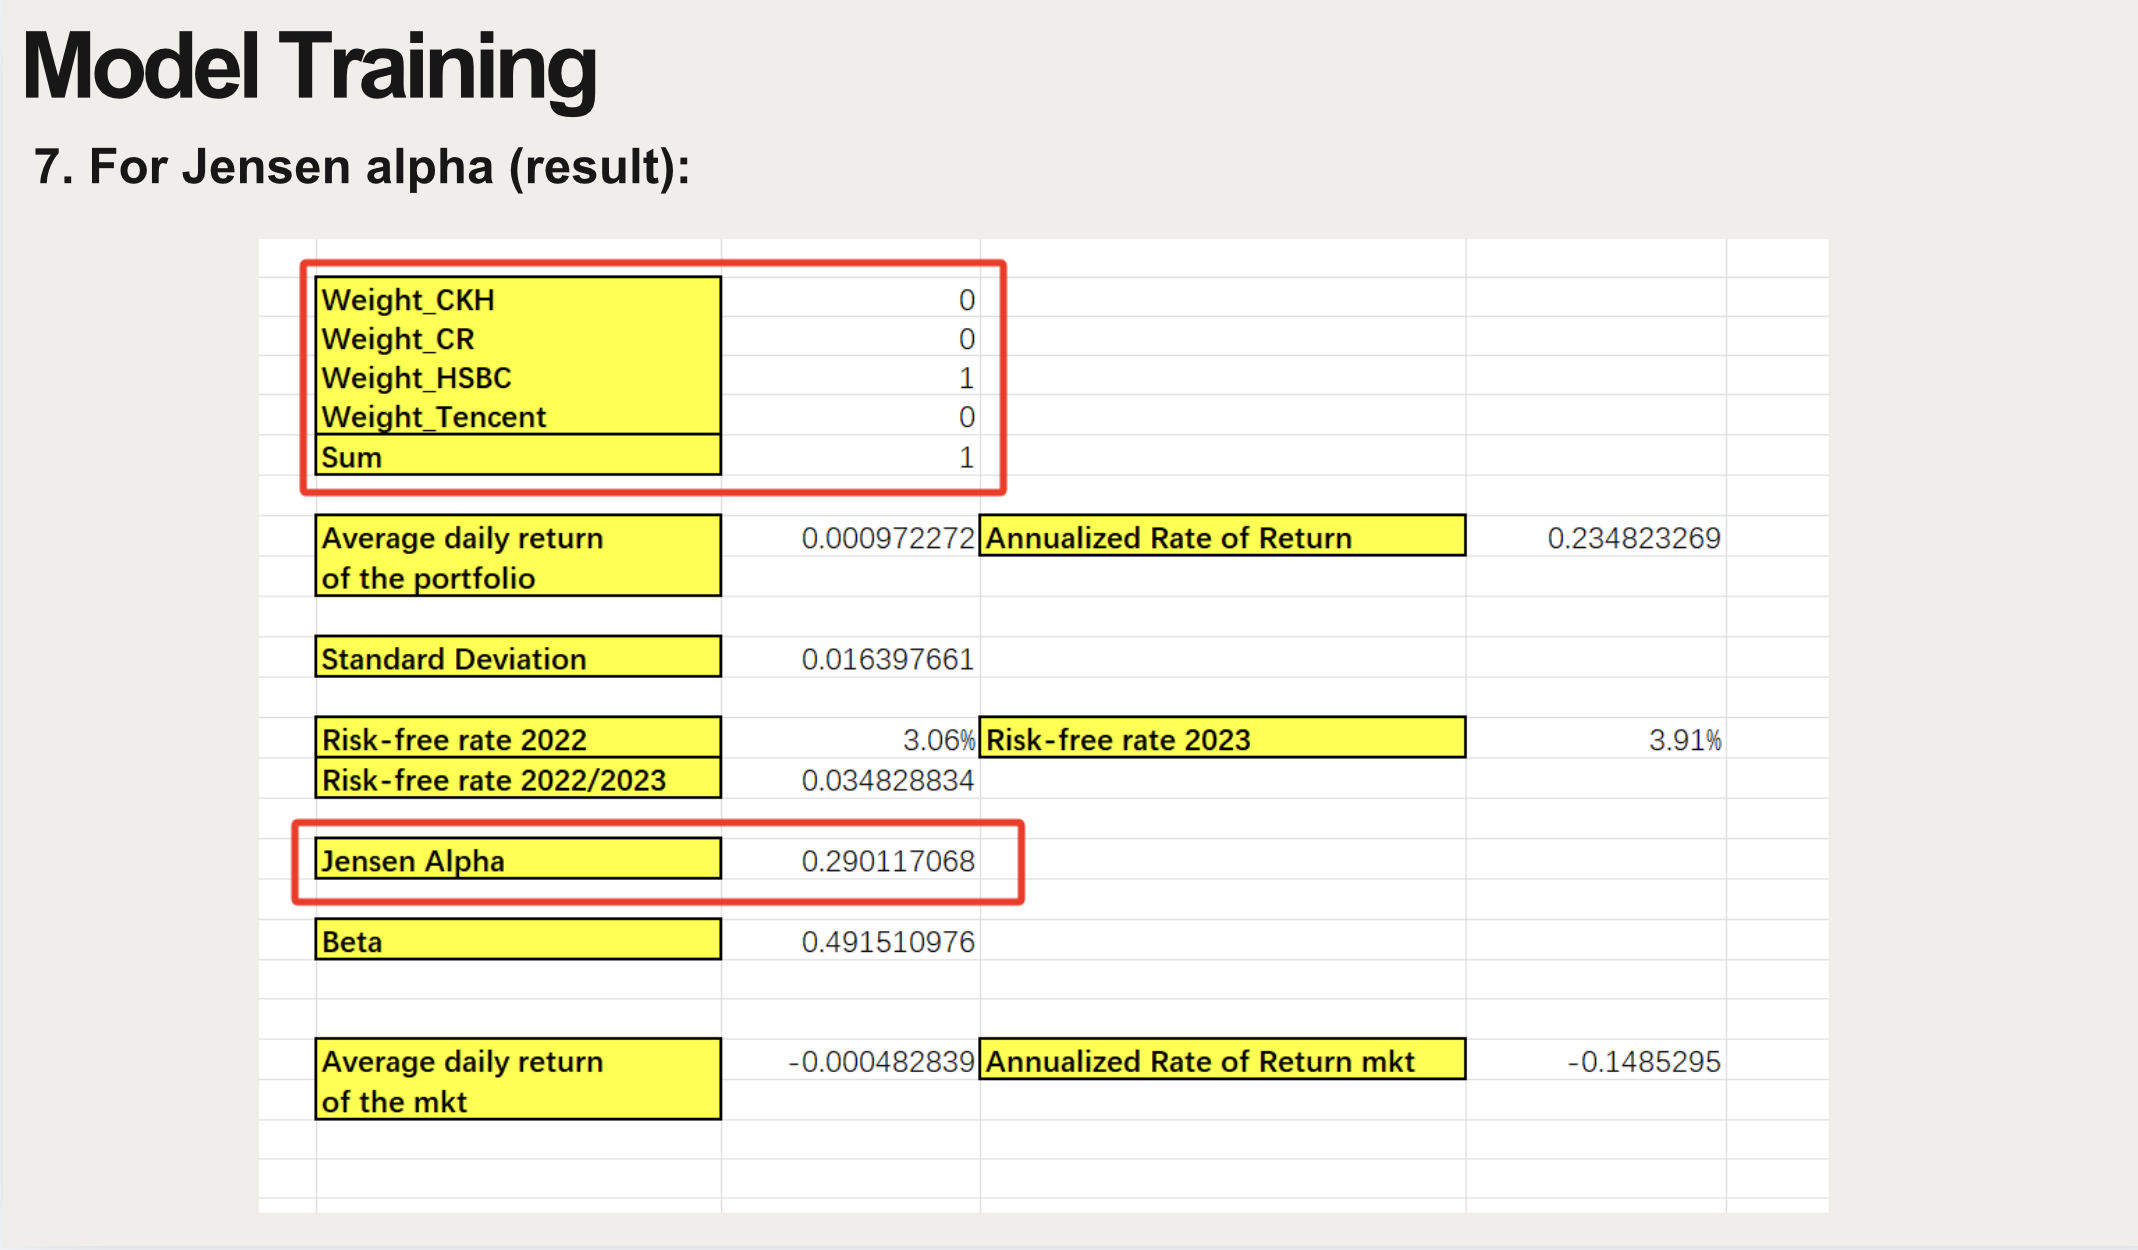
But we observed that the Solver results for all three indices (Sharpe ratio, Treynor ratio, Jensen's alpha) recommend concentrating investments in just a few stocks (e.g., CR and HSBC) rather than diversifying the portfolio(please refer to the attachments below).
Q1. Why does this violate the principle of diversification?
Sharpe ratio suggests buying only CR(0.02) and HSBC(0.98), 0 in other 2 stocks. Sum of weights is 1.
Treynor ratio and Jensen's alpha recommend 100% HSBC, 0 in other 3 stocks.
Q2. Why do the recommended stocks differ across the three indices?
For example, Sharpe includes CR, while Treynor/Jensen focus solely on HSBC.
Potential factors I've considered:
Solver constraints: No lower and upper limit on individual stock weights.
Stock-specific metrics: Differences in Beta, Alpha, average daily return, and daily return standard deviation.
Could you explain the specific reasons behind this? What else could be driving these results?
Your explanations would be highly appreciated!!!
Step by Step Solution
There are 3 Steps involved in it

Get step-by-step solutions from verified subject matter experts