

Question: We are using Costco, Inc. Current Market values on date of submission. 4 pts each. (32pts) Refer to either www.finance.yahoo.com or www.cnbc.com 12. Stock Price
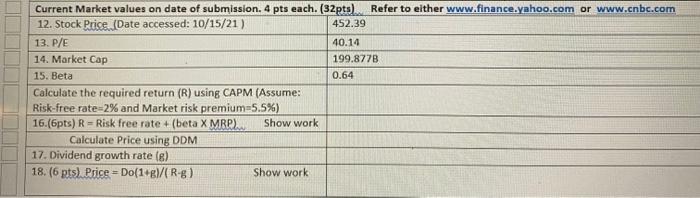
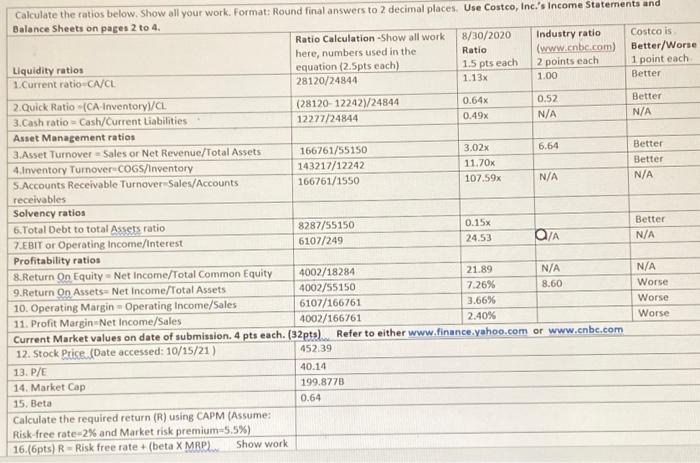
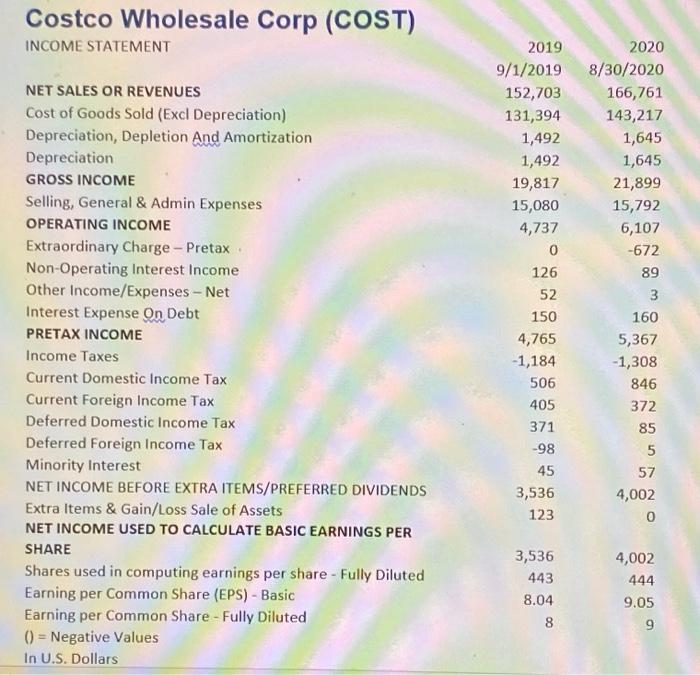
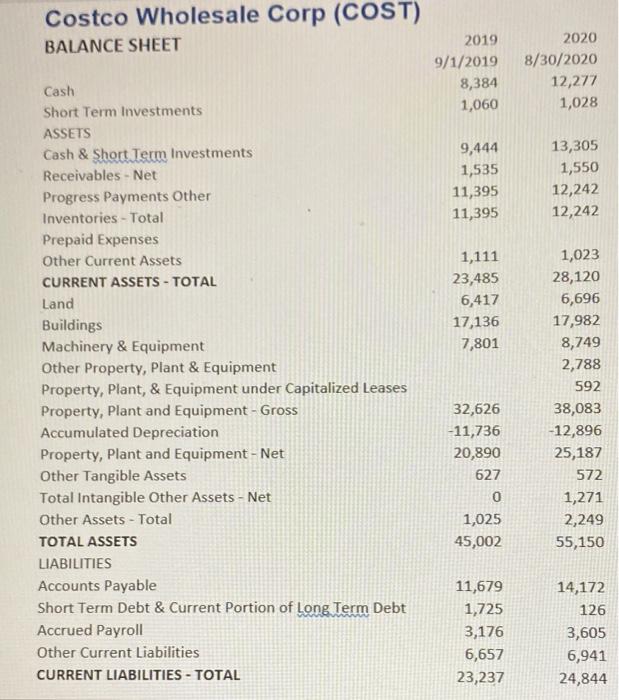
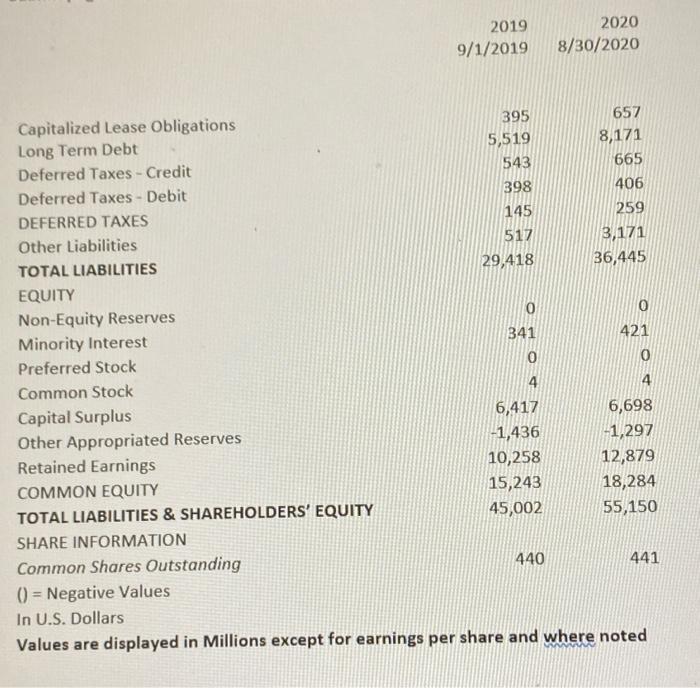
Current Market values on date of submission. 4 pts each. (32pts) Refer to either www.finance.yahoo.com or www.cnbc.com 12. Stock Price (Date accessed: 10/15/21) 452.39 13. P/E 40.14 14. Market Cap 199.8778 15. Beta 0.64 Calculate the required return (R) using CAPM (Assume: Risk-free rate=2% and Market risk premium=5.5%) 16.(6pts) R = Risk free rate +(beta X MRR Show work Calculate Price using DDM 17. Dividend growth rate (6) 18. (6 pts) Prics =Do(1)/(R-8) Show work Calculate the ratios below. Show all your work. Format: Round final answers to 2 decimal places. Use Costco, Inc.'s Income Statements and Balance Sheets on pages 2 to 4 Ratio Calculation -Show all work 8/30/2020 Industry ratio Costco is here, numbers used in the Ratio (www.cnbc.com) Better/Worse Liquidity ratios equation (2.5pts each) 1.5 pts each 2 points each 1 point each 1. Current ratio CA/C 28120/24844 1.13x 1.00 Better 2.Quick Ratio (CA Inventoryl/CL (28120-12242)/24844 0.64x 0.52 Better 3.Cash ratio=Cash/Current Liabilities 12277/24844 0.49x N/A N/A Asset Management ratios 3.Asset Turnover - Sales or Net Revenue/Total Assets 166761/55150 3.02 6.64 Better 4.Inventory Tumover. COGS/inventory 143217/12242 11.70x Better 5. Accounts Receivable Turnover-Sales/Accounts 166761/1550 107.59x N/A N/A receivables Solvency ratios 6. Total Debt to total Assets ratio 8287/55150 0.15% Better 7.EBIT or Operating Income/Interest 6107/249 24.53 OA N/A Profitability ratios 8. Return On Equity - Net Income/Total Common Equity 4002/18284 21.89 N/A N/A 9.Return On Assets=Net Income/Total Assets 4002/55150 7.26% 8.60 Worse 10. Operating Margin-Operating Income/Sales 6107/166761 3.66% Worse 11. Profit Margin-Net Income/Sales 4002/166761 2.40% Worse Current Market values on date of submission. 4 pts each. (32pts). Refer to either www.finance.yahoo.com or www.cnbc.com 12. Stock Price. (Date accessed: 10/15/21) 452.39 13. P/E 40.14 14. Market Cap 199.8778 15. Beta 0.64 Calculate the required return (R) using CAPM (Assume: Risk free rate-2% and Market risk premium 5,5%) 16.(6pts) R Risk free rate + (beta X MRP) Show work Costco Wholesale Corp (COST) INCOME STATEMENT 2019 9/1/2019 152,703 131,394 1,492 1,492 19,817 15,080 4,737 0 126 2020 8/30/2020 166,761 143,217 1,645 1,645 21,899 15,792 6,107 -672 89 3 160 5,367 -1,308 846 372 85 5 57 4,002 0 NET SALES OR REVENUES Cost of Goods Sold (Excl Depreciation) Depreciation, Depletion And Amortization Depreciation GROSS INCOME Selling, General & Admin Expenses OPERATING INCOME Extraordinary Charge - Pretax Non-Operating Interest Income Other Income/Expenses - Net Interest Expense On Debt PRETAX INCOME Income Taxes Current Domestic Income Tax Current Foreign Income Tax Deferred Domestic Income Tax Deferred Foreign Income Tax Minority Interest NET INCOME BEFORE EXTRA ITEMS/PREFERRED DIVIDENDS Extra Items & Gain/Loss Sale of Assets NET INCOME USED TO CALCULATE BASIC EARNINGS PER SHARE Shares used in computing earnings per share - Fully Diluted Earning per Common Share (EPS) - Basic Earning per Common Share - Fully Diluted () = Negative Values In U.S. Dollars 52 150 4,765 -1,184 506 405 371 -98 45 3,536 123 3,536 443 8.04 4,002 444 9.05 9 8 Costco Wholesale Corp (COST) BALANCE SHEET 2019 9/1/2019 8,384 1,060 2020 8/30/2020 12,277 1,028 9,444 1,535 11,395 11,395 13,305 1,550 12,242 12,242 1,111 23,485 6,417 17,136 7,801 Cash Short Term Investments ASSETS Cash & Short Term Investments Receivables - Net Progress Payments Other Inventories - Total Prepaid Expenses Other Current Assets CURRENT ASSETS - TOTAL Land Buildings Machinery & Equipment Other Property, Plant & Equipment Property, Plant, & Equipment under Capitalized Leases Property, Plant and Equipment - Gross Accumulated Depreciation Property, plant and Equipment - Net Other Tangible Assets Total Intangible Other Assets - Net Other Assets - Total TOTAL ASSETS LIABILITIES Accounts Payable Short Term Debt & Current Portion of Long Term Debt Accrued Payroll Other Current Liabilities CURRENT LIABILITIES - TOTAL 1,023 28,120 6,696 17,982 8,749 2,788 592 38,083 -12,896 25,187 572 1,271 2,249 55,150 32,626 -11,736 20,890 627 0 1,025 45,002 11,679 1,725 3,176 6,657 23,237 14,172 126 3,605 6,941 24,844 2019 9/1/2019 2020 8/30/2020 Capitalized Lease Obligations 395 657 Long Term Debt 5,519 8,171 Deferred Taxes - Credit 543 665 Deferred Taxes - Debit 398 406 DEFERRED TAXES 145 259 Other Liabilities 517 3,171 TOTAL LIABILITIES 29,418 36,445 EQUITY Non-Equity Reserves 0 Minority Interest 341 421 Preferred Stock 0 0 Common Stock 4 4 Capital Surplus 6,417 6,698 Other Appropriated Reserves -1,436 -1,297 Retained Earnings 10,258 12,879 COMMON EQUITY 15,243 18,284 TOTAL LIABILITIES & SHAREHOLDERS' EQUITY 45,002 55,150 SHARE INFORMATION Common Shares Outstanding 440 441 () = Negative Values In U.S. Dollars Values are displayed in Millions except for earnings per share and where noted
Step by Step Solution
There are 3 Steps involved in it

Get step-by-step solutions from verified subject matter experts