

Question: We collect the following data for a simple reaction using our NEB/DFT code: Normalized Reaction Coordinate 0.0 1.2 2.8 4.1 5.8 7.7 7.9 (x, arbitrary
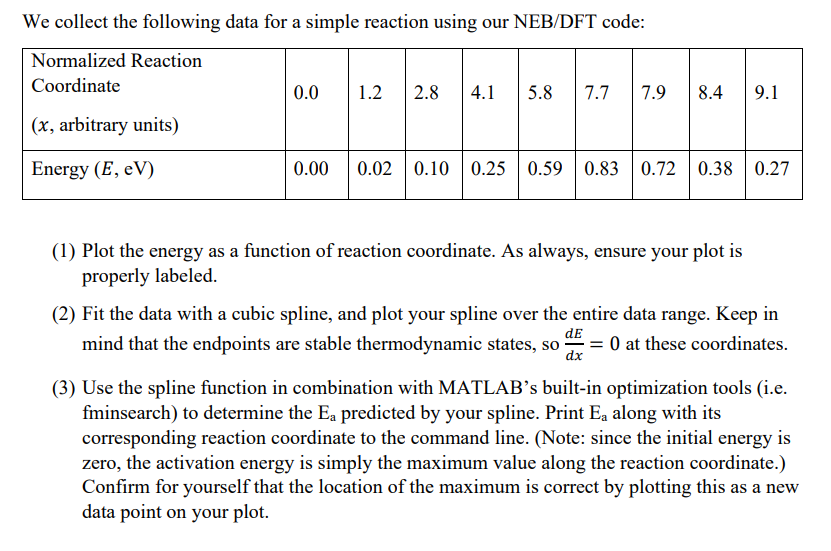
We collect the following data for a simple reaction using our NEB/DFT code: Normalized Reaction Coordinate 0.0 1.2 2.8 4.1 5.8 7.7 7.9 (x, arbitrary units) 8.4 9.1 Energy (E, eV) 0.00 0.02 0.10 0.25 0.59 0.83 0.72 0.38 0.27 (1) Plot the energy as a function of reaction coordinate. As always, ensure your plot is properly labeled. (2) Fit the data with a cubic spline, and plot your spline over the entire data range. Keep in dE mind that the endpoints are stable thermodynamic states, so ay O at these coordinates. dx (3) Use the spline function in combination with MATLAB's built-in optimization tools (i.e. fminsearch) to determine the Ea predicted by your spline. Print E, along with its corresponding reaction coordinate to the command line. (Note: since the initial energy is zero, the activation energy is simply the maximum value along the reaction coordinate.) Confirm for yourself that the location of the maximum is correct by plotting this as a new data point on your plot. a We collect the following data for a simple reaction using our NEB/DFT code: Normalized Reaction Coordinate 0.0 1.2 2.8 4.1 5.8 7.7 7.9 (x, arbitrary units) 8.4 9.1 Energy (E, eV) 0.00 0.02 0.10 0.25 0.59 0.83 0.72 0.38 0.27 (1) Plot the energy as a function of reaction coordinate. As always, ensure your plot is properly labeled. (2) Fit the data with a cubic spline, and plot your spline over the entire data range. Keep in dE mind that the endpoints are stable thermodynamic states, so ay O at these coordinates. dx (3) Use the spline function in combination with MATLAB's built-in optimization tools (i.e. fminsearch) to determine the Ea predicted by your spline. Print E, along with its corresponding reaction coordinate to the command line. (Note: since the initial energy is zero, the activation energy is simply the maximum value along the reaction coordinate.) Confirm for yourself that the location of the maximum is correct by plotting this as a new data point on your plot. a
Step by Step Solution
There are 3 Steps involved in it

Get step-by-step solutions from verified subject matter experts