

Question: We did not go over this.. please help with as much detail as possible. thank you so much. Sampling Distribution of the Mean Suppose you
We did not go over this.. please help with as much detail as possible. thank you so much.
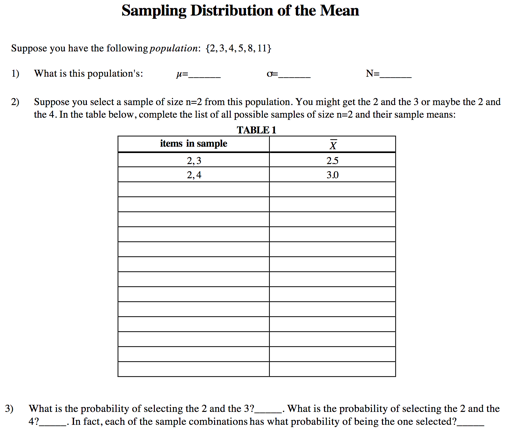
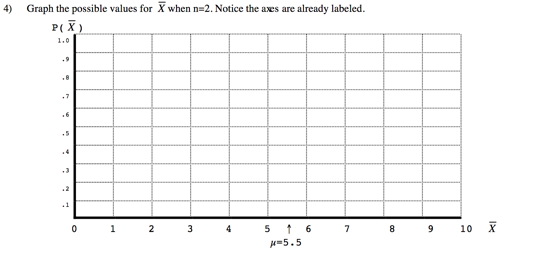
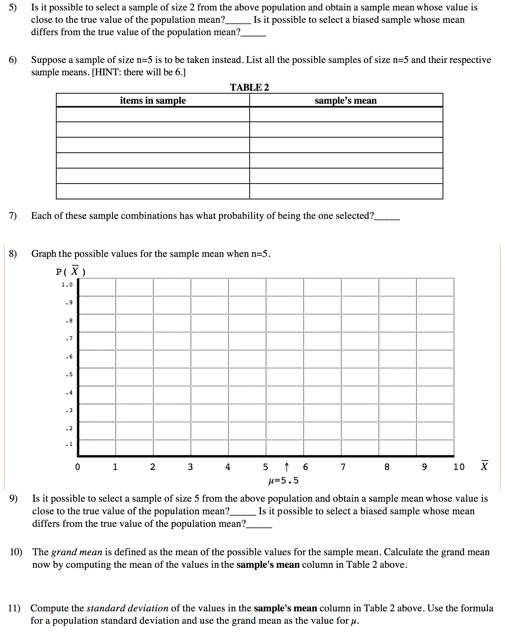
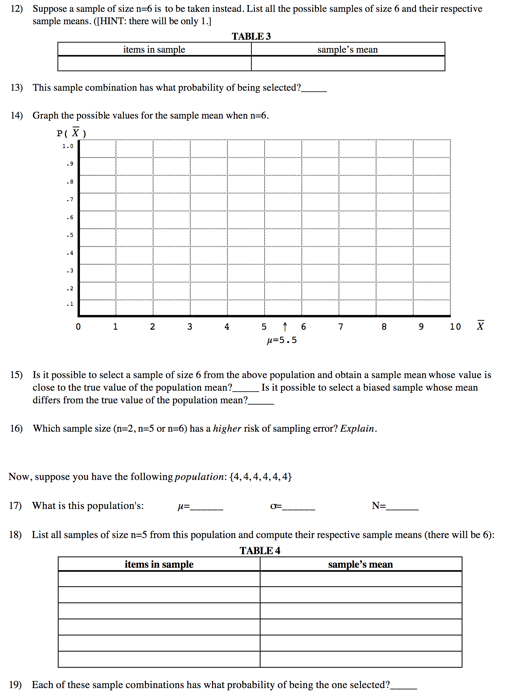
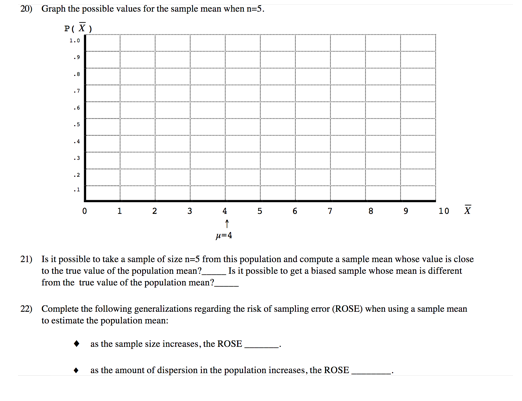
Sampling Distribution of the Mean Suppose you have the following population: (2.3,4,5,8,11} 1) What is this population's: 2) Suppose you select a sample of size n=2 from this population. You might get the 2 and the 3 or maybe the 2 and the 4. In the table below, complete the list of all possible samples of size n=2 and their sample means: TABLE 1 items in sample X 2.3 25 2.4 30 3) What is the probability of selecting the 2 and the 3?_. What is the probability of selecting the 2 and the 47 - In fact, each of the sample combinations has what probability of being the one selected?4) Graph the possible values for X when n=2. Notice the axes are already labeled. P ( X ) 1. 0 . 7 2 3 1 6 7 8 # 5.5 9 10 x5) Is it possible to select a sample of size 2 from the above population and obtain a sample mean whose value is close to the true value of the population mean? Is it possible to select a biased sample whose mean differs from the true value of the population mean? 6) Suppose a sample of size n=5 is to be taken instead. List all the possible samples of size n=5 and their respective sample means. [HINT: there will be 6.] TABLE 2 items in sample sample's mean 7) Each of these sample combinations has what probability of being the one selected? 8) Graph the possible values for the sample mean when n=5. P( X ) -7 5 6 7 8 9 10 X # 5.5 9) Is it possible to select a sample of size 5 from the above population and obtain a sample mean whose value is close to the true value of the population mean?_ Is it possible to select a biased sample whose mean differs from the true value of the population mean? 10) The grand mean is defined as the mean of the possible values for the sample mean. Calculate the grand mean now by computing the mean of the values in the sample's mean column in Table 2 above. 11) Compute the standard deviation of the values in the sample's mean column in Table 2 above. Use the formula for a population standard deviation and use the grand mean as the value for p.Suppose a sample of size n=6 is to be taken instead. List all the possible samples of size 6 and their respective sample means. ([HINT: there will be only 1.] TABLE 3 items in sample sample's mean 13) This sample combination has what probability of being selected?_ 14) Graph the possible values for the sample mean when n=6. P ( X ) 1.0 -7 2 5 6 7 9 10 X -5.5 15) Is it possible to select a sample of size 6 from the above population and obtain a sample mean whose value is close to the true value of the population mean? Is it possible to select a biased sample whose mean differs from the true value of the population mean? 16) Which sample size (n 2. n=5 or n=6) has a higher risk of sampling error? Explain. Now, suppose you have the following population: {4,4, 4,4.4,4) 17) What is this population's: N=_ 18) List all samples of size n=5 from this population and compute their respective sample means (there will be 6): TABLE 4 items in sample sample's mean 19) Each of these sample combinations has what probability of being the one selected?_20) Graph the possible values for the sample mean when n=5. P( X ) 2 3 5 7 8 9 10 X # 4 21) Is it possible to take a sample of size n=5 from this population and compute a sample mean whose value is close to the true value of the population mean? from the true value of the population mean? Is it possible to get a biased sample whose mean is different 22) Complete the following generalizations regarding the risk of sampling error (ROSE) when using a sample mean to estimate the population mean: as the sample size increases, the ROSE as the amount of dispersion in the population increases, the ROSE
Step by Step Solution
There are 3 Steps involved in it

Get step-by-step solutions from verified subject matter experts