

Question: We discussed a paper in class that had some problems in how they analyzed and interpreted the data. The table below contains the amount of
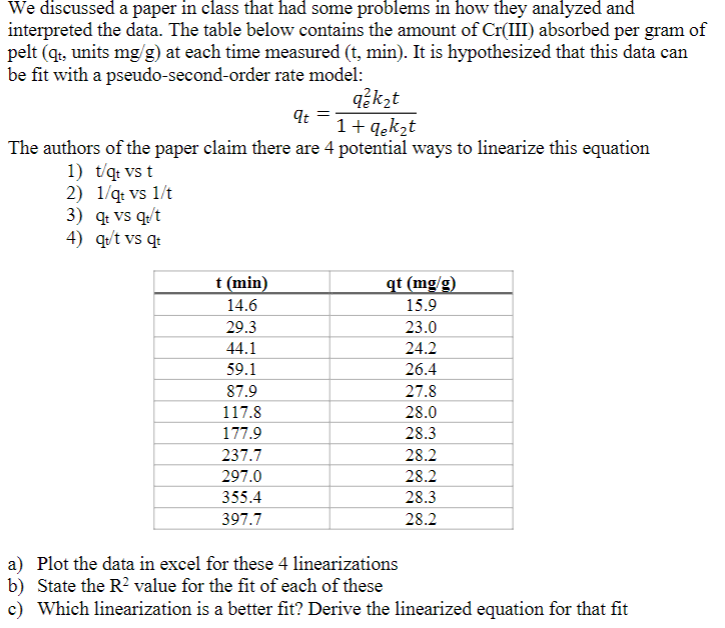
We discussed a paper in class that had some problems in how they analyzed and interpreted the data. The table below contains the amount of Cr (III) absorbed per gram of pelt ( qt, units mg/g ) at each time measured ( t,min ). It is hypothesized that this data can be fit with a pseudo-second-order rate model: qt=1+qek2tqe2k2t The authors of the paper claim there are 4 potential ways to linearize this equation 1) t/qt vs t 2) 1/qt vs 1/t 3) qtvsqt/t 4) qt/t vs qt a) Plot the data in excel for these 4 linearizations b) State the R2 value for the fit of each of these c) Which linearization is a better fit? Derive the linearized equation for that fit
Step by Step Solution
There are 3 Steps involved in it

Get step-by-step solutions from verified subject matter experts