

Question: We drew the chart in Figure using data from The Boston Globe on April 15, 2012. 30% 28% 22% a. Estimate the mode, median
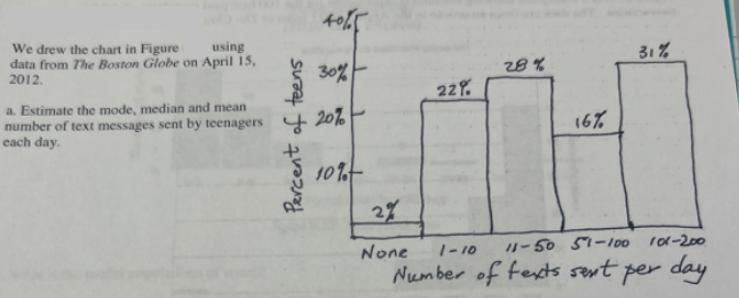
We drew the chart in Figure using data from The Boston Globe on April 15, 2012. 30% 28% 22% a. Estimate the mode, median and mean number of text messages sent by teenagers 20% each day. Percent of teens 10% 27 None 1-10 16% 31% 11-50 51-100 1-200 Number of texts sent per day b. In total, approximately how many text messages are sent by the 23 million American teens each day? c. The percentages don't add up to 100%. Why might that have happened? d. What percent of teenagers text more than the median amount? e. Does the figure display a histogram?
Step by Step Solution
There are 3 Steps involved in it

Get step-by-step solutions from verified subject matter experts