

Question: We have a process as shown in the right figure. (M1-M4 are the names for four machines. The numbers are activity times in minutes).
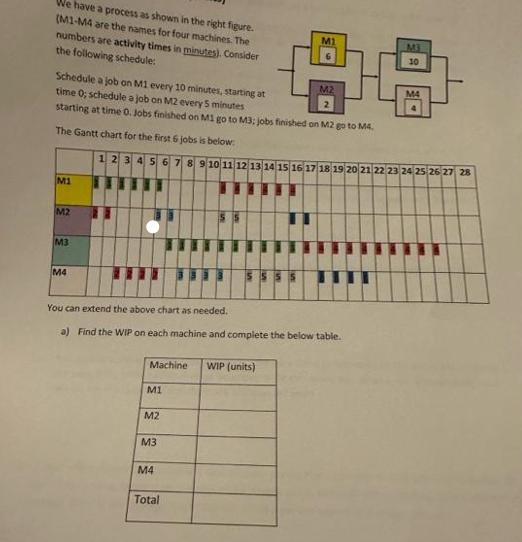

We have a process as shown in the right figure. (M1-M4 are the names for four machines. The numbers are activity times in minutes). Consider the following schedule: Schedule a job on M1 every 10 minutes, starting at time 0; schedule a job on M2 every 5 minutes starting at time 0. Jobs finished on M1 go to M3: jobs finished on M2 go to M4. The Gantt chart for the first 6 jobs is below: M1 M2 M3 M4 12345678 9 10 11 12 13 14 15 16 17 18 19 20 21 22 2 Machine WIP (units) You can extend the above chart as needed. a) Find the WIP on each machine and complete the below table. M1 M2 M1 M3 M4 M2 Total PA 3 L 10 MA NY 26 27 28 MI b) What is the average throughput time, L.e., flow time [in mins)? c) is the process demand-or supply-constrained? What is the flow rate under the given schedule (in units/hour)? d) What is the actual cycle time under this schedule (in minutes)?
Step by Step Solution
3.49 Rating (146 Votes )
There are 3 Steps involved in it

Get step-by-step solutions from verified subject matter experts