

Question: We have a technical analysis chart for a commodity trading using MACD rule from 01/10/2020 Through 31/05/2022 an evaluation of how MACD (Moving Average Convergence
We have a technical analysis chart for a commodity trading using MACD rule from 01/10/2020 Through 31/05/2022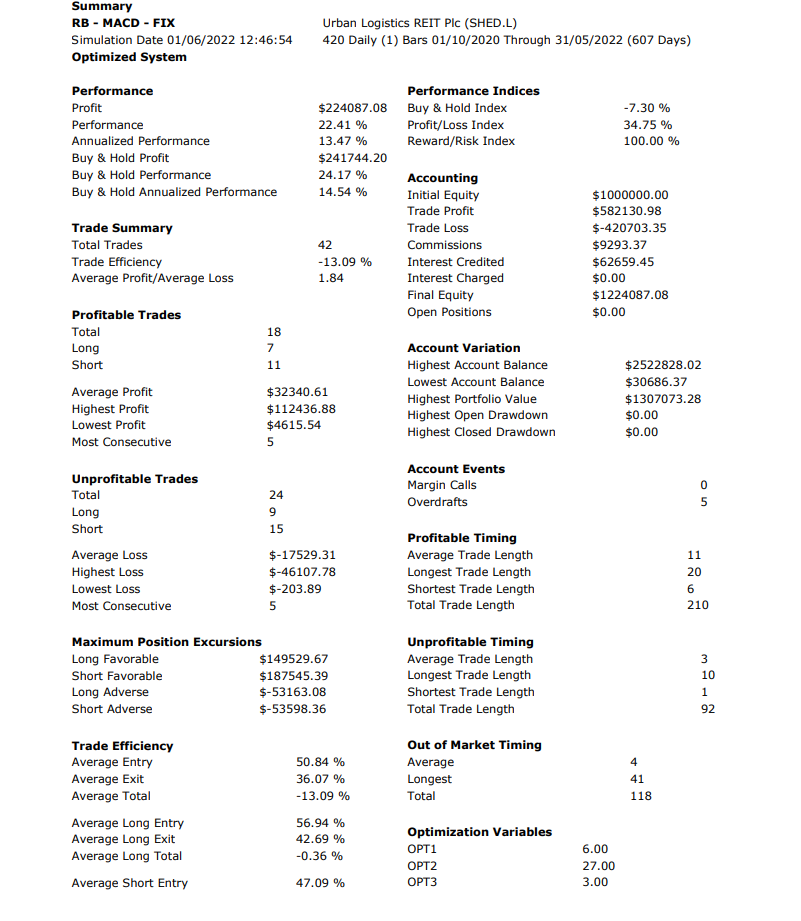
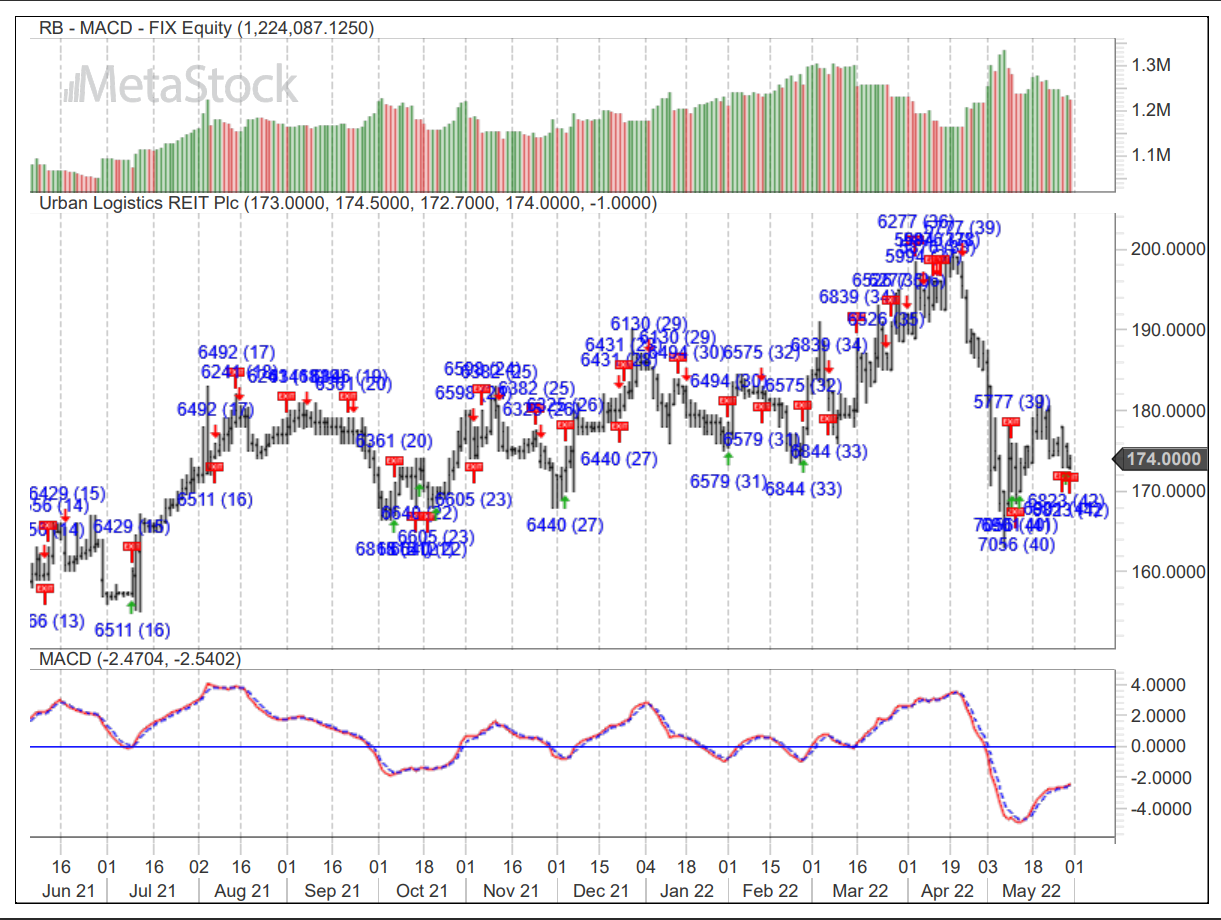 an evaluation of how MACD (Moving Average Convergence and Divergence) have performed in the prediction set (2021-22), including benchmarking against plausible alternative uses of the client's funds, and possible interventions during this period.
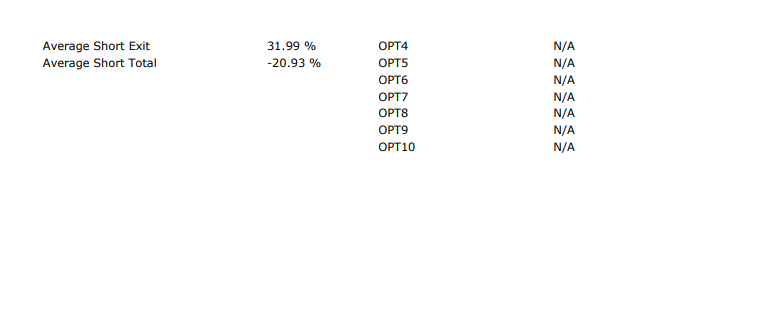
Summary Urban Logistics REIT Plc (SHED.L) RB - MACD - FIX 420 Daily (1) Bars 01/10/2020 Through 31/05/2022 (607 Days) Optimized System UnprofitableTradesTotalLongShortAverageLossHighestLossLowestLossMostConsecutive24915$17529.31$46107.78$203.895AccountEventsMarginCallsOverdraftsProfitableTimingAverageTradeLengthLongestTradeLengthShortestTradeLengthTotalTradeLength11 MaximumPositionExcursionsLongFavorableShortFavorableLongAdverseShortAdverseUnprofitableTiming$149529.67$187545.39$53163.08$53598.36AverageTradeLengthLongestTradeLengthShortestTradeLengthTotalTradeLength101 TradeEfficiencyAverageEntryAverageExitAverageTotalAverageLongEntryAverageLongExitAverageLongTotal50.84%36.07%13.09%56.94%42.69%0.36%OutofMarketTimingAverageLongestTotalOptimizationVariablesOPT1OPT24411186.0027.00 Average Short Exit 31.99%20.93%OPT4OPT5OPT6OPT7OPT8OPT9OPT10N/AN/AN/AN/AN/AN/AN/A N/A Summary Urban Logistics REIT Plc (SHED.L) RB - MACD - FIX 420 Daily (1) Bars 01/10/2020 Through 31/05/2022 (607 Days) Optimized System UnprofitableTradesTotalLongShortAverageLossHighestLossLowestLossMostConsecutive24915$17529.31$46107.78$203.895AccountEventsMarginCallsOverdraftsProfitableTimingAverageTradeLengthLongestTradeLengthShortestTradeLengthTotalTradeLength11 MaximumPositionExcursionsLongFavorableShortFavorableLongAdverseShortAdverseUnprofitableTiming$149529.67$187545.39$53163.08$53598.36AverageTradeLengthLongestTradeLengthShortestTradeLengthTotalTradeLength101 TradeEfficiencyAverageEntryAverageExitAverageTotalAverageLongEntryAverageLongExitAverageLongTotal50.84%36.07%13.09%56.94%42.69%0.36%OutofMarketTimingAverageLongestTotalOptimizationVariablesOPT1OPT24411186.0027.00 Average Short Exit 31.99%20.93%OPT4OPT5OPT6OPT7OPT8OPT9OPT10N/AN/AN/AN/AN/AN/AN/A N/A
Step by Step Solution
There are 3 Steps involved in it

Get step-by-step solutions from verified subject matter experts