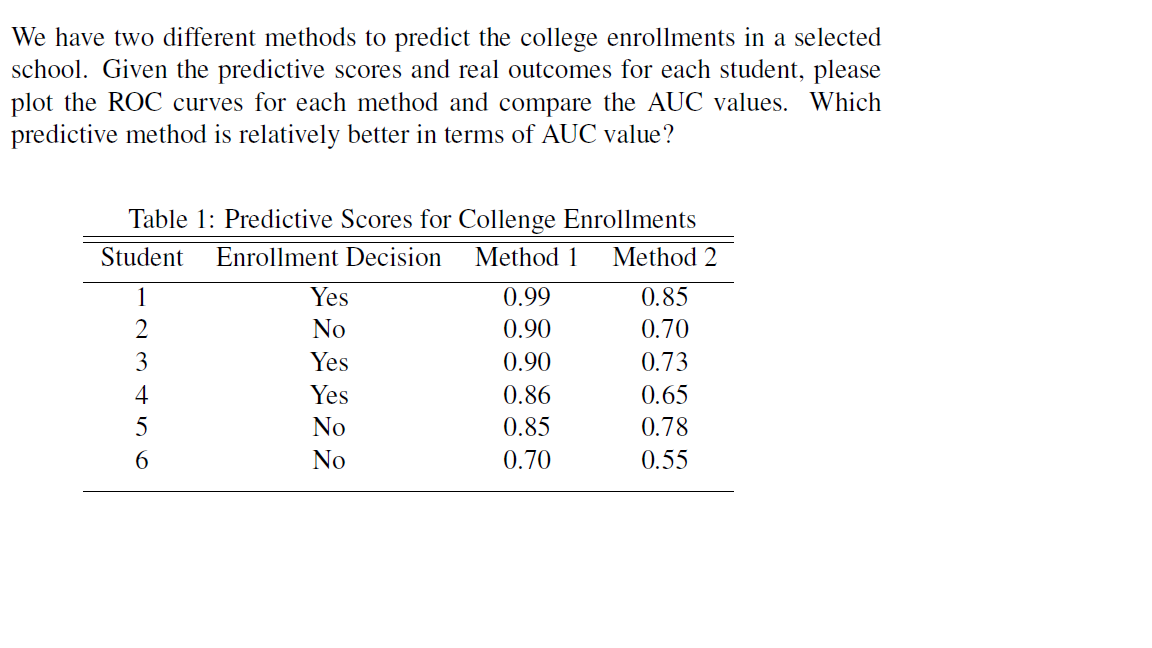
Question: We have two different methods to predict the college enrollments in a selected school. Given the predictive scores and real outcomes for each student, please

We have two different methods to predict theWe have two different methods to predict theWe have two different methods to predict theWe have two different methods to predict the

We have two different methods to predict the college enrollments in a selected school. Given the predictive scores and real outcomes for each student, please plot the ROC curves for each method and compare the AUC values. Which predictive method is relatively better in terms of AUC value? Table 1: Predictive Scores for Collenge Enrollments Student Enrollment Decision Method 1 Method 2 1 Yes 0.99 0.85 2 No 0.90 0.70 3 Yes 0.90 0.73 4 Yes 0.86 0.65 5 No 0.85 0.78 6 No 0.70 0.55 1.00 - 0.75 - 0.50 - 0.25 ACE 0.00 1.00 0.75 0.50 - Partial ACF 0.25 0.00 0 5 10 15 20 lag 1.0 - 0.5 - ACF 0.0 -0.5 1.0 - 0.5 Partial ACF 0.0 -0.5 - 0 10 20 lag (b) 1.0 - 0.5 0.0 ACF 1 --- ------ ---L -0.5 - 1.0 - 0.5 - 0.0 Partial ACF -0.5 0 5 10 15 20 lag (C)

Step by Step Solution

There are 3 Steps involved in it

1 Expert Approved Answer
Step: 1 Unlock blur-text-image
Question Has Been Solved by an Expert!

Get step-by-step solutions from verified subject matter experts

Step: 2 Unlock
Step: 3 Unlock

Students Have Also Explored These Related General Management Questions!