

Question: we need to write all the answer to the questions with R STUDIO. these questions are related to probabilty. first of all, you can solve
we need to write all the answer to the questions with R STUDIO. 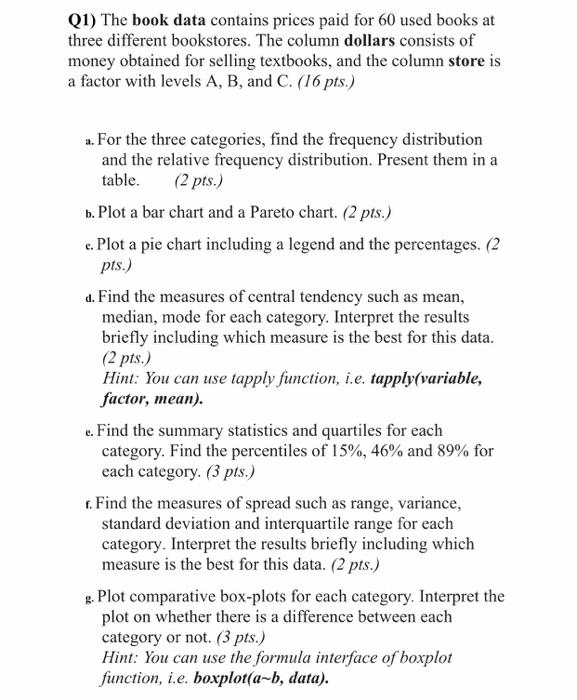
these questions are related to probabilty. first of all, you can solve with probabilty information. and then, you can write these solutions on R studio. so, these solutions seem lise code.
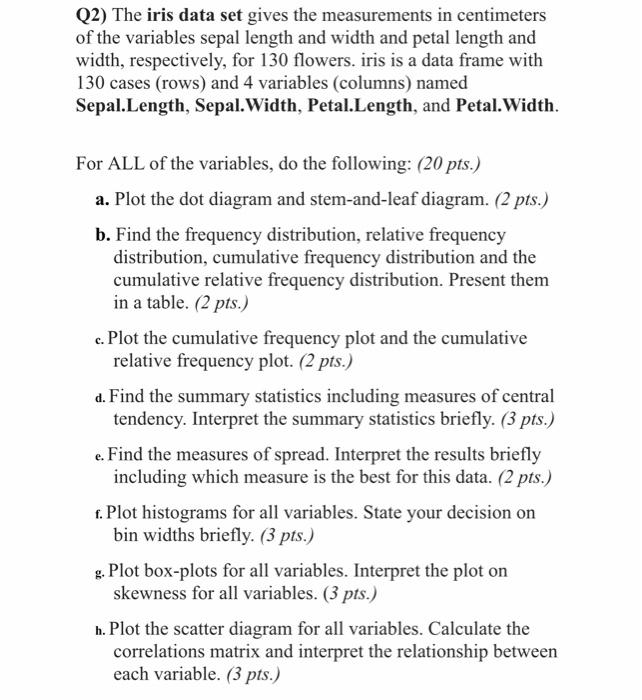
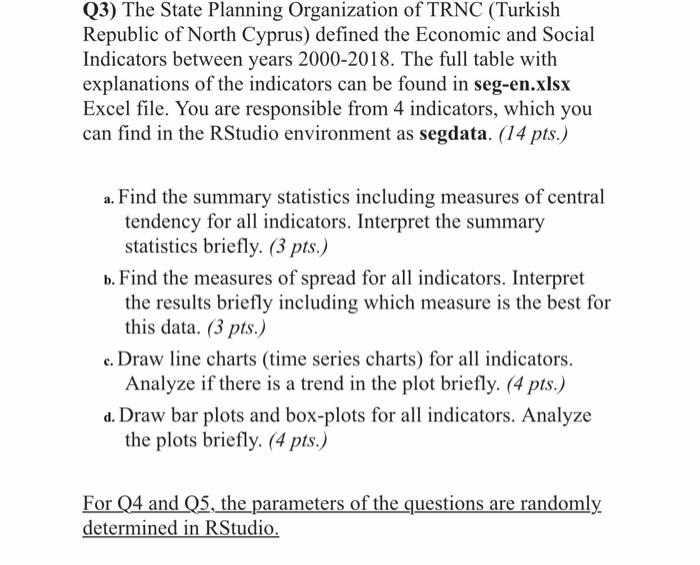
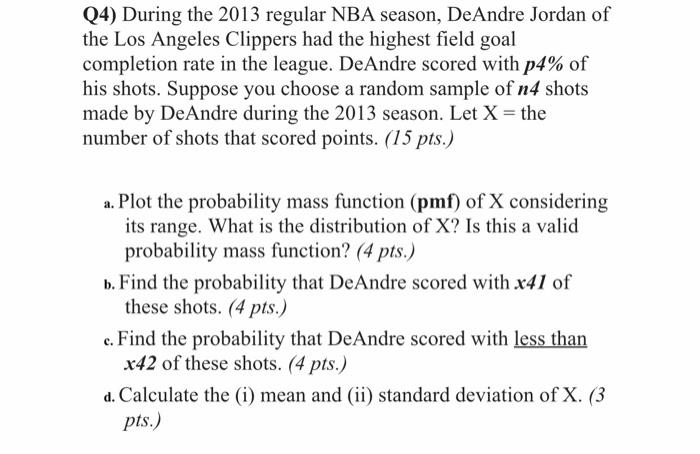
Q1) The book data contains prices paid for 60 used books at three different bookstores. The column dollars consists of money obtained for selling textbooks, and the column store is a factor with levels A, B, and C. (16 pts.) a. For the three categories, find the frequency distribution and the relative frequency distribution. Present them in a table. (2 pts.) b. Plot a bar chart and a Pareto chart. (2 pts.) c. Plot a pie chart including a legend and the percentages. (2 pts.) d. Find the measures of central tendency such as mean, median, mode for each category. Interpret the results briefly including which measure is the best for this data. (2 pts.) Hint: You can use tapply function, i.e. tapply(variable, factor, mean). e. Find the summary statistics and quartiles for each category. Find the percentiles of 15%, 46% and 89% for each category. (3 pts.) 1. Find the measures of spread such as range, variance, standard deviation and interquartile range for each category. Interpret the results briefly including which measure is the best for this data. (2 pts.) g. Plot comparative box-plots for each category. Interpret the plot on whether there is a difference between each category or not. (3 pts.) Hint: You can use the formula interface of boxplot function, i.e. boxplot(a-b, data). Q2) The iris data set gives the measurements in centimeters of the variables sepal length and width and petal length and width, respectively, for 130 flowers. iris is a data frame with 130 cases (rows) and 4 variables (columns) named Sepal.Length, Sepal.Width, Petal.Length, and Petal.Width. For ALL of the variables, do the following: (20 pts.) a. Plot the dot diagram and stem-and-leaf diagram. (2 pts.) b. Find the frequency distribution, relative frequency distribution, cumulative frequency distribution and the cumulative relative frequency distribution. Present them in a table. (2 pts.) c. Plot the cumulative frequency plot and the cumulative relative frequency plot. (2 pts.) d. Find the summary statistics including measures of central tendency. Interpret the summary statistics briefly. (3 pts.) e. Find the measures of spread. Interpret the results briefly including which measure is the best for this data. (2 pts.) f. Plot histograms for all variables. State your decision on bin widths briefly. (3 pts.) g. Plot box-plots for all variables. Interpret the plot on skewness for all variables. (3 pts.) h. Plot the scatter diagram for all variables. Calculate the correlations matrix and interpret the relationship between each variable. (3 pts.) Q3) The State Planning Organization of TRNC (Turkish Republic of North Cyprus) defined the Economic and Social Indicators between years 2000-2018. The full table with explanations of the indicators can be found in seg-en.xlsx Excel file. You are responsible from 4 indicators, which you can find in the RStudio environment as segdata. (14 pts.) a. Find the summary statistics including measures of central tendency for all indicators. Interpret the summary statistics briefly. (3 pts.) b. Find the measures of spread for all indicators. Interpret the results briefly including which measure is the best for this data. (3 pts.) c. Draw line charts (time series charts) for all indicators. Analyze if there is a trend in the plot briefly. (4 pts.) d. Draw bar plots and box-plots for all indicators. Analyze the plots briefly. (4 pts.) For Q4 and Q5, the parameters of the questions are randomly determined in RStudio. Q4) During the 2013 regular NBA season, DeAndre Jordan of the Los Angeles Clippers had the highest field goal completion rate in the league. DeAndre scored with p4% of his shots. Suppose you choose a random sample of n4 shots made by DeAndre during the 2013 season. Let X = the number of shots that scored points. (15 pts.) a. Plot the probability mass function (pmf) of X considering its range. What is the distribution of X? Is this a valid probability mass function? (4 pts.) b. Find the probability that DeAndre scored with x41 of these shots. (4 pts.) c. Find the probability that DeAndre scored with less than x42 of these shots. (4 pts.) d. Calculate the (i) mean and (ii) standard deviation of X. (3 pts.) Q5) Pat is required to sell candy bars to raise money for the 6th grade field trip. There are thirty houses in the neighborhood, and Pat is not supposed to return home until n5 candy bars have been sold. So the child goes door to door, selling candy bars. At each house, there is a p5 probability of selling one candy bar. (35 pts.) ..Plot the probability mass function (pmf) of X considering its range. What is the distribution of X? Is this a valid probability mass function? (4 pts.) 1. What is the probability of Pat selling the last candy bar at the x57th house? (4 pts.) c. What is the probability of Pat finishing on or before the x52th house? (4 pts.) 4. Calculate the (i) mean and (ii) standard deviation of X. (3 pts.) Now consider the situation that Pat is not supposed to return home until he sells a single candy bar. Answer the following questions considering the new situation. e. Plot the probability mass function (pmf) of X considering its range. What is the distribution of X? Is this a valid probability mass function? (4 pts.) 1. What is the probability of Pat selling the candy bar at the *53th house? (4 pts.) 2. What is the probability of Pat finishing on or after the x-54th house? (4 pts.) h. What is the probability of Pat selling the candy bar at the 53th house given that he sold no candy bars at the first x54 houses? Interpret the result and give the name of the property. Are there other probability distributions satisfying this property? (5 pts.) 1. Calculate the (i) mean and (ii) standard deviation of X. (3 pts.)
Step by Step Solution
There are 3 Steps involved in it
1 Expert Approved Answer
Step: 1 Unlock

Sure Ill help guide you through solving these questions u... View full answer
Question Has Been Solved by an Expert!
Get step-by-step solutions from verified subject matter experts
Step: 2 Unlock
Step: 3 Unlock