

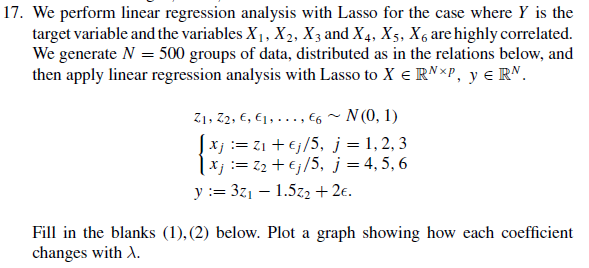
Question: We perform linear regression analysis with Lasso for the case where Y is the target variable and the variables x 1 , x 2 ,
We perform linear regression analysis with Lasso for the case where is the
target variable and the variables and are highly correlated.
We generate groups of data, distributed as in the relations below, and
then apply linear regression analysis with Lasso to
dots,
:
:
Fill in the blanks below. Plot a graph showing how each coefficient
changes with n
x npzerosn
z npzerosn
for k in range:
z: k nprandom.randnn
y ## Blank ##
for j in range:
x: j z: nprandom.randnn
for j in range:
x: j z: nprandom.randnn
lambdaseq nparange
p
r lenlambdaseq
coefseq npzerosr p
cols blue "red", "green", "yellou", "purple", "orange"
for i in ranger:
coefseqi : ## Blank ##
for j in rangep:
pltplotnploglambdaseq coefseq: j j
ccolsj labelXstrj
pltylabelr
pltlegendloc"upper left
plttitleLasso
Step by Step Solution
There are 3 Steps involved in it
1 Expert Approved Answer
Step: 1 Unlock

Question Has Been Solved by an Expert!
Get step-by-step solutions from verified subject matter experts
Step: 2 Unlock
Step: 3 Unlock