Question: The U.S. Census Bureau tracks the median price for new home sales by month The median prices for April for the years 1990 to 2011

The U.S. Census Bureau tracks the median price for new home sales by month The median prices for April for the years 1990 to 2011 follow (U.S. Census Bureau site, April 16, 2012).


Year Price ($1000s) Year Price ($1000s) ana 175.2 1990 1991 1992 1993


a. Construct a time series plot. Comment on any pattern you observe. Discuss some of the factors that may have resulted in this time series plot.
b. Given the time series plot in part (a), do you think the forecasting methods developed in this section are appropriate for this time series? Explain.
c. To forecast a value for April 2012, how much of the past data would you use?

Explain. a. b. c.
Trend Projection 
We present two forecasting methods in this section that are appropriate for time series exhibiting a trend pattern. First, we show how simple linear regression can be us forecast a time series with a linear trend. Next we show how the curve-fitting capablity of regression analysis can also be used to forecast time series with a curvilinear onlinear trend.

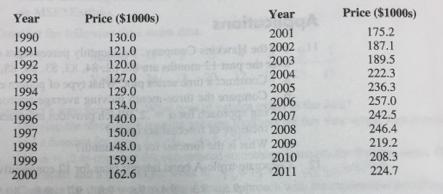
Year Price ($1000s) Year Price ($1000s) ana 175.2 1990 1991 1992 1993 1994 2001 2002 2003 2004 2005 2006 2007 2008 130.0 121.0 187.1 189.5 120.0 127.0 129.0 222.3 236.3 134.0 140.0 257.0 242.5 1995 1996 246.4 1997 1998 150.0 148.0 2009 219.2 2010 208.3 1999 2000 159.9 162.6 2011 224.7

Step by Step Solution

3.41 Rating (154 Votes )

There are 3 Steps involved in it

1 Expert Approved Answer
Step: 1 Unlock

X x X1990 y x 2 xy 1990 0 130 0 0 1991 1 121 1 121 1992 2 120 4 240 1993 3 127 9 381 1994 4 129 16 ... View full answer

blur-text-image
Question Has Been Solved by an Expert!

Get step-by-step solutions from verified subject matter experts

Step: 2 Unlock
Step: 3 Unlock

Students Have Also Explored These Related Accounting Questions!