

Question: We will be discussing the graph below on January 24 and 26. It shows the yield curve derived from U.S. Treasury securities at different points
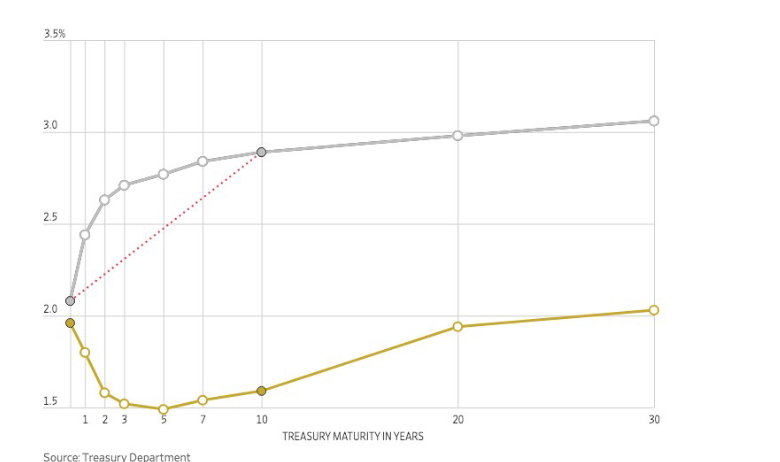
We will be discussing the graph below on January 24 and 26. It shows the yield curve derived from U.S. Treasury securities at different points in time. a. The grey line shows the yield curve as of Sep 2018. We call this a 'normal' or 'upward sloping' yield curve. The yield to maturity of long-term bonds was higher than the yield to maturity of short-term bonds. Please explain (in a just few words) one reason why the yield curve is usually upward sloping?
b. One year later, Sep 2019, the yield curve showed an anomaly: the yield to maturity of 10-year bonds was lower than the yield to maturity of 1-year bonds. This is called an 'inverted' yield curve and this shape does not occur often. What do you think investors expect when the yield curve becomes inverted?
Step by Step Solution
There are 3 Steps involved in it

Get step-by-step solutions from verified subject matter experts