

Question: We will conduct a hypothetical analysis of Pierce Transit's potential investment in bus rapid transit (BRT) along the Pacific Avenue corridor. It is recommended
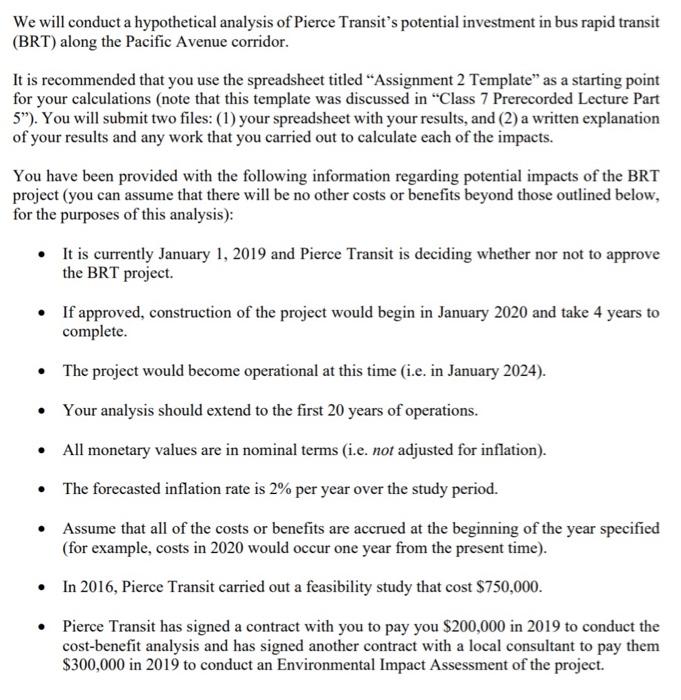
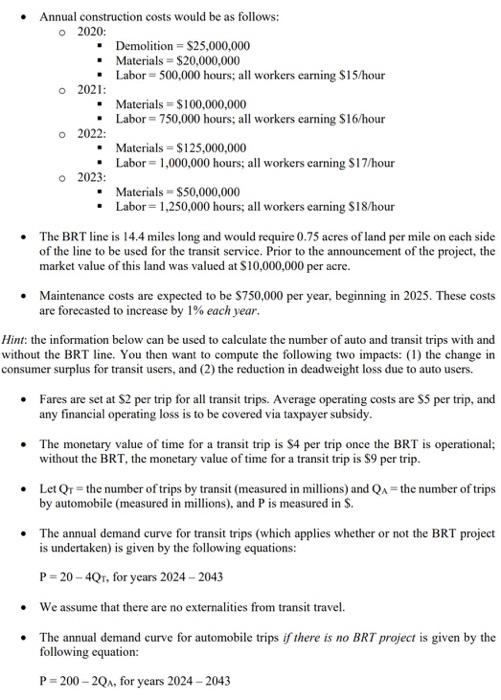
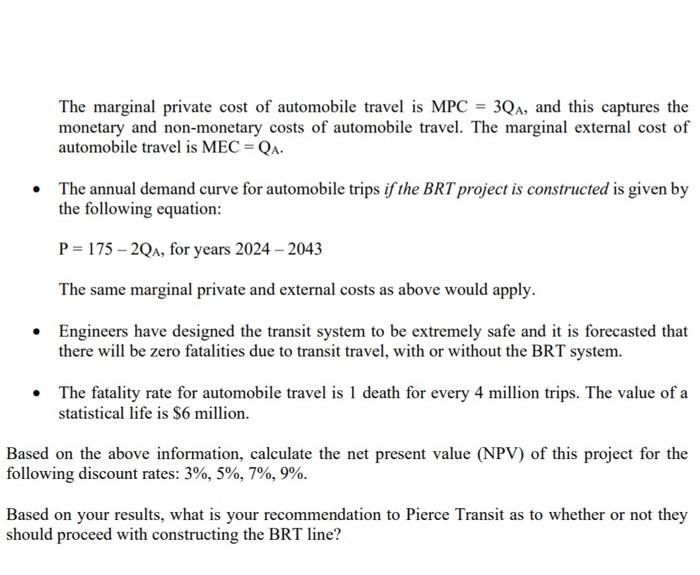
We will conduct a hypothetical analysis of Pierce Transit's potential investment in bus rapid transit (BRT) along the Pacific Avenue corridor. It is recommended that you use the spreadsheet titled "Assignment 2 Template" as a starting point for your calculations (note that this template was discussed in "Class 7 Prerecorded Lecture Part 5"). You will submit two files: (1) your spreadsheet with your results, and (2) a written explanation of your results and any work that you carried out to calculate each of the impacts. You have been provided with the following information regarding potential impacts of the BRT project (you can assume that there will be no other costs or benefits beyond those outlined below, for the purposes of this analysis): It is currently January 1, 2019 and Pierce Transit is deciding whether nor not to approve the BRT project. If approved, construction of the project would begin in January 2020 and take 4 years to complete. The project would become operational at this time (i.e. in January 2024). Your analysis should extend to the first 20 years of operations. All monetary values are in nominal terms (i.e. not adjusted for inflation). The forecasted inflation rate is 2% per year over the study period. Assume that all of the costs or benefits are accrued at the beginning of the year specified (for example, costs in 2020 would occur one year from the present time). In 2016, Pierce Transit carried out a feasibility study that cost $750,000. Pierce Transit has signed a contract with you to pay you $200,000 in 2019 to conduct the cost-benefit analysis and has signed another contract with a local consultant to pay them $300,000 in 2019 to conduct an Environmental Impact Assessment of the project. Annual construction costs would be as follows: O 2020: Demolition = $25,000,000 Materials = $20,000,000 Labor = 500,000 hours; all workers carning $15/hour o 2021: Materials = $100,000,000 Labor = 750,000 hours; all workers earning $16/hour o 2022: Materials = S125,000,000 Labor = 1,000,000 hours; all workers carning S17/hour 2023: Materials = $50,000,000 Labor = 1,250,000 hours; all workers earning $18/hour The BRT line is 14.4 miles long and would require 0.75 acres of land per mile on each side of the line to be used for the transit service. Prior to the announcement of the project, the market value of this land was valued at $10,000,000 per acre. Maintenance costs are expected to be $750,000 per year, beginning in 2025. These costs are forecasted to increase by 1% each year. Hint: the information below can be used to calculate the number of auto and transit trips with and without the BRT line. You then want to compute the following two impacts: (1) the change in consumer surplus for transit users, and (2) the reduction in deadweight loss due to auto users. Fares are set at $2 per trip for all transit trips. Average operating costs are $5 per trip, and any financial operating loss is to be covered via taxpayer subsidy. The monetary value of time for a transit trip is $4 per trip once the BRT is operational; without the BRT, the monetary value of time for a transit trip is $9 per trip. Let Qr = the number of trips by transit (measured in millions) and QA=the number of trips by automobile (measured in millions), and P is measured in S. The annual demand curve for transit trips (which applies whether or not the BRT project is undertaken) is given by the following equations: P= 20 4Qr, for years 2024 - 2043 We assume that there are no externalities from transit travel. The annual demand curve for automobile trips if there is no BRT project is given by the following equation: P= 200 2QA, for years 2024 - 2043 The marginal private cost of automobile travel is MPC = 3QA, and this captures the monetary and non-monetary costs of automobile travel. The marginal external cost of automobile travel is MEC = QA. The annual demand curve for automobile trips if the BRT project is constructed is given by the following equation: P = 175 2QA, for years 2024 - 2043 The same marginal private and external costs as above would apply. Engineers have designed the transit system to be extremely safe and it is forecasted that there will be zero fatalities due to transit travel, with or without the BRT system. The fatality rate for automobile travel is 1 death for every 4 million trips. The value of a statistical life is $6 million. Based on the above information, calculate the net present value (NPV) of this project for the following discount rates: 3%, 5%, 7%, 9%. Based on your results, what is your recommendation to Pierce Transit as to whether or not they should proceed with constructing the BRT line?
Step by Step Solution
3.39 Rating (152 Votes )
There are 3 Steps involved in it
Bus rapid transit BRT also called a busway or transitway is a busbased public transport system designed to have better capacity and reliability than a conventional bus system Typically a BRT system includes roadways that are dedicated to buses and gives priority to buses at intersections where buses may interact with other traffic alongside design features to reduce delays caused by passengers boarding or leaving buses or paying fares BRT aims to combine the capacity and speed of a metro with the flexibility lower cost and simplicity of a bus system The first comprehensive BRT system in ... View full answer

Get step-by-step solutions from verified subject matter experts