

Question: We will use graphical analysis extensively in our course occasionally supplemented by some mathematics. Given a graph of a line, it's relatively easy and very
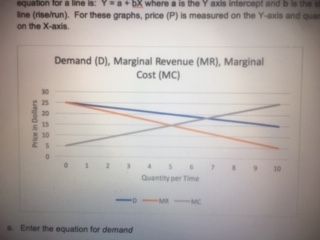
We will use graphical analysis extensively in our course occasionally supplemented by some mathematics. Given a graph of a line, it's relatively easy and very helpful to derive the equation of the line. For each of the three lines below, enter the equation of the line. Demand, marginal revenue, and marginal cost are essential elements of many microeconomic models, but it is not necessary to define line represents yet. For this problem, these are just convenient labels for the lines (linear curves).The generic equation for a line is:Y = a + bX whereais the Y axis intercept andbis the slope of the line (rise/run).For these graphs, price (P) is measured on the Y-axis and quantity (Q) is on the X-axis.
\f
Step by Step Solution
There are 3 Steps involved in it

Get step-by-step solutions from verified subject matter experts